Download
1 / 15
150 likes | 417 Views
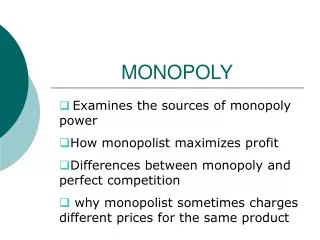
Monopoly . Chapter 15-5 Comparison of Perfect Competition & Monopoly. Comparing Monopoly and Perfect Competition. Equilibrium output for both the monopolist and the competitor is determined by the MC = MR condition. Comparing Monopoly and Perfect Competition.

E N D
Monopoly Chapter 15-5 Comparison of Perfect Competition & Monopoly
Comparing Monopoly and Perfect Competition • Equilibrium output for both the monopolist and the competitor is determined by the MC = MR condition.
Comparing Monopoly and Perfect Competition • Because the monopolist’s marginal revenue is below its price, price and quantity will not be the same. • The monopolist’s equilibrium output is less than, and its price is higher than, for a firm in a competitive market.
MC Monopolist price Competitive price D 1 2 3 4 5 6 7 8 9 10 MR Price $36 30 24 18 12 6 0 6 12
The Welfare Loss from Monopoly • People’s purchase decisions don’t reflect the true cost to society because monopolies charge a price higher than marginal cost.
The Welfare Loss from Monopoly • The marginal cost of increasing output is lower than the marginal benefit of increasing output.
The Welfare Loss from Monopoly • The welfare loss of a monopolist is represented by the triangles B and D. • The welfare loss is often called the deadweight loss or welfare loss triangle.
Price MC PM C D PC B A MR D 0 Quantity QM QC McGraw-Hill/Irwin © 2004 The McGraw-Hill Companies, Inc., All Rights Reserved.
The Welfare Loss from a Monopoly • The welfare loss from a monopoly is represented by the triangles B and D • The rectangle C is a transfer of surplus from the consumer to the monopolist • The area A represents the opportunity cost of diverted resources, which is not a loss to society P MC PM C D PPC B D A MR Q QM QPC 15-10
Barriers to Entry • Natural Ability • A firm is better at producing the good than anyone else • Economies of Scale • Natural monopolyis when a single firm can produce at a lower cost than can two or more firms • Government-Created Monopolies • Patents, licenses, and franchises If there were no barriers to entry, profit-maximizing firms would always compete away monopoly profits 15-11
A Natural Monopoly Graph Average Cost • One firm producing Q1 has average cost C1 • If two firms share the market, each produces Q0.5 and has average cost C0.5 • If three firms share the market, each produces Q0.33 has average cost C0.33 C0.33 C0.5 C1 ATC Q Q0.33 Q0.5 Q1 15-12
A Natural Monopoly Graph, Profit and Regulation • A natural monopolist produces QM and charges PM, therefore earning a profit Average Cost • If there is government regulation and a competitive solution where P = MC is required, the monopolist produces QCand charges PC, therefore earning a loss PM Profits CM CC ATC Losses PC MC MR D Q QM QC 15-13
Normative Views of Monopoly • Monopolies are unjust because they restrict freedom to enter business • Monopolies transfer income from “deserving” consumers to “undeserving” monopolists • Monopolies cause potential monopolists to waste resources trying to get monopolies • Rent-seeking activities 15-14
Government Policy and Monopoly: AIDS Drugs • A few companies have patents for AIDS drugs that enable them to charge high prices because demand is inelastic • Policy Options • Government regulation where price = marginal cost benefits society, but discourages research • Government purchase of the patents and allowing anyone to produce the drugs so their price = marginal cost. This is expensive for taxpayers. 15-15