Download
1 / 19
190 likes | 283 Views
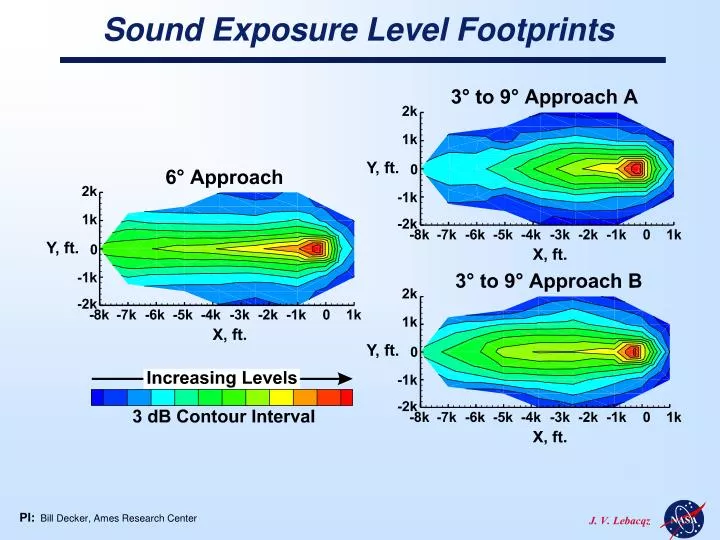
Sound Exposure Level Footprints. PI: Bill Decker, Ames Research Center. Operations System Examples: Terminal Area Productivity (TAP) & Advanced Air Transportation Technologies (AATT) Projects. The Air Traffic Management Process.

E N D
Sound Exposure Level Footprints PI: Bill Decker, Ames Research Center
Operations System Examples:Terminal Area Productivity (TAP) &Advanced Air Transportation Technologies (AATT) Projects
The Air Traffic Management Process Dynamic Route Planner Hazard Avoidance System Expedite Departure Path Traffic Management Advisor ROTO DROM T-NASA AILS CTAS-FMS Integ AVOSS Surface Movement Advisor Final Approach Spacing Tool Collaborative Arrival Planner Airline Operations Tower TRACON Center TRACON Tower AATT Tools/Technologies TAP Tools/Technologies
ARIES Vehicle Enables NASA to test capacity-enhancing technologies in a relevant operational environment. • Functional check flight and 3 instrument check flights completed in Dec. 1998. • FAA/CAA Ohio Valley ADS-B andCDTI flight experiments support. • AILS flight research for Termial Area Productivity Project in ASC • Flight Deck Research Station (FDRS) configured on left side of cockpit • FDRS flight displays and head-up display formats generated by the TRS POC:Doug Arbuckle, NASA Langley Research Center
TAP PROJECT APPROACH More Operations per Runway Buffer due to wake vortex uncertainties Buffer due to imprecise flight management * Runway occupancy time and ground taxi Gap due to inefficient metering & sequencing More Runways per Airport Corridor based on G N & C performance Separation requirements for parallel runway operations Required for: - Time delay in comm. - Wake vortex corridor
Program-level Milestone: Demonstrate AVOSS build 1, version 2 with transport of vortices and class-wise spacing AVOSS Build 1, Version 2 Version 2, operational in AVOSS Lab with live DFW data feeds, to be completed end of FY’99 Final DFW AVOSS Deployment - FY’00 (MS 16) • Core code integrated with real-time AVOSS shell. New features include: • • Weather Nowcast for several hours forecast • • Improvements to observational weather system • • Real-time weather data quality checks and appropriate spacing adjustments • • Improved wake decay & ground effect prediction • • Improved wake sensor-tracking algorithms and sensor-derived wake residence-time in corridor PI:Dave Hinton, NASA Langley Research Center
Airborne Information for Lateral Spacing (AILS) DGPS Ground Station DGPS 24L 24R ADS-B Separation Assurance “blunder’ protection DGPS Own Ship “Other” Aircraft Operational Concept Flight Deck Procedures & Displays … to safely enable closely-spaced independent parallel approach operations through the development of concepts, procedures, and supporting technology. Technologies PI:Brad Perry, NASA Langley Research Center
FMS-CTAS Integration FMS VHF Voice and CPDLC data link Trajectory and preference data Radar data CTAS Advisories Controller Enhanced approach procedures and data exchange help both systems achieve goal of conflict-free, efficient arrivals with minimum delay. PI:Dave Williams, NASA Langley Research Center Ev Palmer, NASA Ames Research Center
Low-Visibility Landing Technologies PERSPECTIVE MOVING MAP LVLASO Objective: Safety achieve clear-weather runway and taxiway capacity for surface low visibility, night or unfamiliar conditions. Accomplish through ROTO, T-NASA, and DROM technologies T-NASA utilizes a combination of head up simulated vision display and moving perspective airfield map. It gets information on the cleared taxi route via datalink from the controller. Other airport surface traffic locations and conflict detection is provided by radar and surface automation plus displays for the controller (T-NASA) Displays HEAD-UP DISPLAY (HUD) SCENE-LINKED SYMBOLOGY PI:Denise Jones, NASA Langley Research Center Dave Foyle, NASA Ames Research Center
CTAS Concept Descent Advisor (DA) advises conflict free fuel efficient descent Descent planning region Final Approach Spacing Tool (FAST) advises for accurate spacing on final approach Traffic Management Advisor (TMA) plans sequence and landing time TMA updates plan and assigns runway Final approach planning region
Traffic Management Advisor (TMA) • Traffic Management tool to provide arrival traffic flow visualization and scheduling • Assists controllers in balancing arrival demand with airport capacity while minimizing delays • Develops a safe and efficient schedule for arrival traffic to maximize airport capacity • Increases airport capacity, reduces arrival delays, and reduces controller workload by advising enroute sector controllers of the optimized schedule PI:Len Tobias, NASA Ames Research Center
Passive Final Approach Spacing Tool (pFAST) Objective: Assist the air traffic controller in maximizing arrival traffic flow to multiple runways. AAL123 Controller advisory instruction: 18R MD80 Sequence Advisory 2 “United 456, you are #3 for runway 18R” “American 123, you are #2 for runway 18R” Controller advisory instruction: UAL456 Runway Advisory 18R 18L 18R B737 3 Approach: Provide recommended runway assignments and sequences to the air traffic controller. Balance use of runways based upon prediction of aircraft runway-crossing times, using accurate aircraft & wind models. Benefits: Maximizing landing throughput reduces delays and fuel usage, thereby reducing flight costs and aircraft emissions. Status: Operational at Dallas-Fort Worth airport and being implemented by FAA at 10 other airports. PI:Tom Davis, NASA Ames Research Center
Surface Movement Advisor (SMA) The Surface Movement Advisor (SMA) is a joint Federal Aviation Administration (FAA) and National Aeronautics and Space Administration (NASA) project to help current airport facilities operate more efficiently. The SMA system integrates the airline schedules, gate information, flight plans, radar feeds and runway configuration (departure split and landing direction). This integrated information is then re-transmitted over the network system and shared between the key players at the airport: Ramp Operators, Airport Managers, The Airline Operators, FAA Controllers and Supervisors Goals: • Provide Gate Resource Optimization • Balance Taxi Departure Loads • Reduce Voice Radio Traffic • Improve Gate Rescheduling • Facilitate Airport Operations Analysis • Improve Crew Scheduling PI:Yuri Gawdiak, NASA Ames Research Center
FFP1 Deployment of Ames Developed Systems SMA TMA & FAST Seattle Boston Minneapolis Salt Lake City New York Cleveland Chicago Oakland Denver Washington Indianapolis Kansas City FAST TMA Los Angeles Atlanta Memphis Albuquerque Ft. Worth SMA, TMA & FAST Jacksonville TMA & FAST Houston Miami TMA SMA, TMA & FAST TMA
Post-FFP1 ATM Tools Cleveland Center New York Center Philadelphia Airport Washington Center Expedite Departure Path Tool Multi-Center TMA ONT Sequencing & Conflict-Free Vector/Speed Advisories TRACON Conflict-Free Climb Departure Fix SNA LAX Collaborative Arrival Planner Direct-to Controller Tool
Benefit Assessment of NASA ATC Tools • Objectives: • Develop an initial set of cross-comparable economic benefits data for each of the AATT decision support tools (DST) for use in project decision making • Approach: • Common input data sets, assessment ground-rules, and economic conversion factors were provided to all the benefit assessment teams to maximize comparability across the various DST assessments • Assessment methodologies and tools were developed which addressed the specific benefit mechanisms of the AATT DST’s • 1996 and 2015 traffic demand levels were analyzed and benefits provided for both years • Benefits assessed at 43 airports as applicable Annual Economic Benefit (1997 $M) AATT Tool 1996 Traffic 2015 Traffic (ATL Only) SMA 15 20 SMS 192 284 TMA 262 421 pFAST 209 939 aFAST 96 503 EDP 152 782 CAP 214 332 EDA 658 1288 P.I.: C. Scofield
Scope of ATM Operational Modes DAG-TM Expansion of Operational Modes in NAS Free- Flight “Mature” State ‘03-’05 Free Flight Phase 1 Current NAS NAS Conceptual Definition
Investigate flight crew and air traffic controller procedures and tools for shared separation tasks Distributed Air Ground Traffic Management: AGIE Study Approach Assist flight crews and controllers with shifting roles and responsibilities Examine human performance parameters for flight crews and controllers in a full-mission simulation environment Impact Airspace factors in shared separation may have an impact upon controller and flight crew conflict detection Ability to contact other flight crews in a free flight environment may be important for assessing conflict probability PI: Sandy Lozito, NASA Ames Research Center
1: Next Generation Capacity Technologies Dr. Tom Edwards: Moderator Dr. Heinz Erzberger: Direct-To Tool Tom Davis: Multi-Center Traffic Management Advisor Tool Dr. Len Tobias: Collaborative Arrival Planner Tool 2: Aviation Human Factors Dr. Terry Allard: Moderator Dr. Dave Neri: Fatigue Countermeasures Dr. Judith Orasanu: CRM & Training Drs. Beau Watson and Roger Remington: Vision and Cognition 3: Information Technologies for Aviation Dave Alfano: Moderator John Kaneshige: Intelligent Flight Controls Dr. Dave Korsmeyer: Design Cycle Improvements Yuri Gawdiak: Data Sharing 4: Next Generation Capacity Technologies Dr. Tom Edwards: Moderator Dr. Heinz Erzberger: Direct-To Tool Tom Davis: Multi-Center Traffic Management Advisor Tool Dr. Len Tobias: Collaborative Arrival Planner Tool 5: Capacity: Distributed Air Ground Traffic Management Steve Green: Moderator Steve Green: Distributed Air-Ground Traffic Management Dr. Ev Palmer: Linking Cockpit and Air Traffic Control Automation Sandy Lozito: Shared Air-Ground Separation Responsibilities 6: Improved Capacity Through Vertical Flight Ed Aiken: Moderator Sandy Hart: Improving Rotorcraft Safety Mark Betzina: Tiltrotor Noise Abatement (Wind Tunnel Tests) Bill Decker: Tiltrotor Noise Abatement (Simulation & Flight Tests) Dr. John Zuk: Runway-Independent Aircraft Operations Breakout Sessions