Download
1 / 17
170 likes | 319 Views
U.S. Maritime Administration. Roger Bohnert Office of Intermodal System Development. Between 1983 and 2003, total vehicle miles traveled in the US has increased almost 90%.

E N D
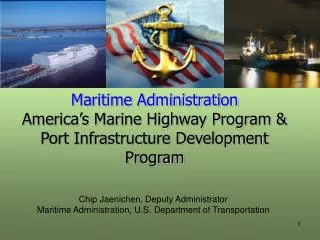
U.S. Maritime Administration Roger Bohnert Office of Intermodal System Development
Between 1983 and 2003, total vehicle miles traveled in the US has increased almost 90%. The Interstate System, which comprises just over 1% of the Nation's total miles of roadway, carries almost 25% of all traffic. Highway congestion increased dramatically between 1983 and 2003, in both extent and duration. In the 10 most congested urban areas of the country, each rush hour traveler “pays” an annual virtual “congestion tax” of between $850 and $1,600 in lost time and fuel. Growing Congestion Congestion in Atlanta
1983 100 2003 80 60 Hours 40 20 0 Atlanta Miami Detroit Boston Phoenix Average Chicago Dallas Houston New York Washington San Francisco Philadelphia LA/Long Beach City Growth in Wasted Hours • Congestion has increased dramatically over the past 2 decades • In the 13 largest cities, drivers spend the equivalent of almost eight work days each year stuck in traffic Annual Hours Lost to Congestion Per Peak Hour Driver Very Large Metro Areas, 1983 v. 2003 Source: Texas Transportation Institute, 2005 Urban Mobility Report
North American Rail Network (Bottlenecks & Congestion Areas)
Atlantic Coast Canadian Border Pacific Coast Gulf Coast Mexican Border Trade Growth, 1860 to 2005 The value of U.S. trade—measured in constant dollars by coast and land border—has grown rapidly over the last 30 years
59,420 NY/NJ 5,566 1,809 Virginia 6,639 1,860 13,101 9,420 Charleston 1,662 Savannah LA/LB (TEUs in thousands) 2004 2020 Projected Port Freight Demand Volume of trade 2004 (actual) v. 2020 (unconstrained)* 15,835 2,557 1,776 Seattle 4,478 4,396 1,798 Tacoma 3,382 2,043 Oakland 6,165 1,437 2,152 1,010 Houston Miami * Forecast figures are based on an unconstrained 10-year linear regression, and do not reflect the expected capacity of each port in 2020.
National Strategy toReduce Congestion • Urban Partnership Agreements • Public-Private Partnerships • Corridors of the Future • Reducing Border Congestion • Reducing Southern California Freight Congestion • Increasing Aviation Capacity
Congestion and Savings MARINE HWY 1 Barge = 456 40’ Containers ENERGY 228 Railcars DBL Stacked = 456 40’ Containers RAIL TRUCK 456 Trucks = 456 40’ Containers = 15 Barrels
Barriers to Success • Competitive disadvantage posed by: • Harbor Maintenance Tax (HMT) • 24-Hour Advance Notice Rule • Multiple Lift Fees for Marine Transport • Lack of Awareness of Marine Highway benefits • Availability of Financing and Investment • State/Local Authorities and Shippers • Inadequate Port Infrastructure • Shortage of Assets (i.e., cranes, chassis, barges, etc.) • Environmental/Emissions
Current Administration Support • February 2007 – Testified before Congress in support of America’s Marine Highway Initiative • April 2007 - Maritime Administration Reorganization • Established Office of Marine Highways and Passenger Services • Established 10 Gateway Offices nationwide that will support America’s Marine Highways at the local and regional level • Ongoing - Provide Incentives and Remove Disincentives • Focus on areas where operations already exist or industry/local support is present. • Consideration of Legislative and Regulatory Initiatives.
Current Administration Support Cont. • November 2006 – October 2007 Carrier/ Shipper Workshops • November 2006 – New York, NY - Large Shippers • February 2007 – Tampa, FL – Hazmat Shippers • June 2007 – Oakland, CA – Inter-port movements • October 2007 – Little Rock, AR –Metropolitan Planning Organizations • May 2006 – U. S./Canada/Mexico Trilateral Agreement • Established Steering Group to address issues and impediments • Developing an “Information Clearing House” trilateral website • Developing Shipper information • October 2007 –Administrator to Meet with Mexican Counterpart • Identify solutions that mitigate border crossing congestion • Seek opportunities for marine highway operations between the U.S. and Mexico • October 2007 - Release Marine Highway Informational Video
Building the Marine Highway Industry Solutions for the expansion of America’s Marine Highway… • Contribute and participate in expanding America’s Marine Highway network. • Seek job growth opportunities for Americans. • Seek increased opportunities for Public-Private Partnerships. • Get the Word Out – This is a Solution. • Get State and Local Support. • Get Shipper and Carrier Support. • Focus on projects that can work in near-term to show success.
America’s Marine Highway Initiative Website www.marad.dot.gov/mhi