Download
1 / 23
230 likes | 372 Views
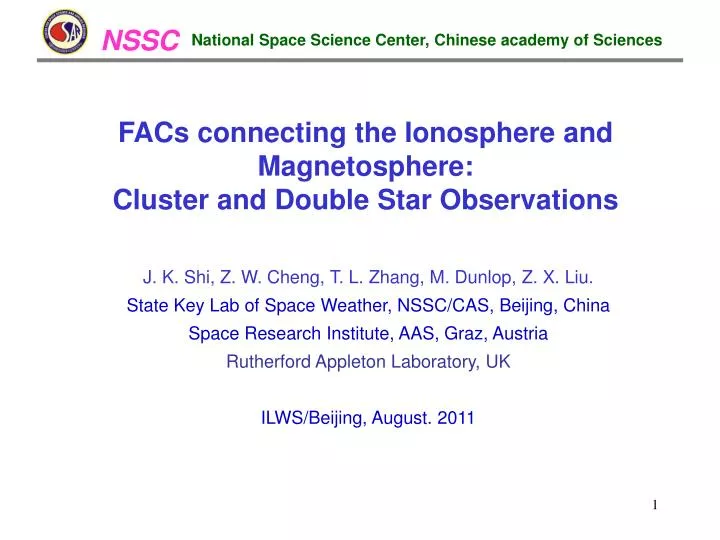
N SS C. National Space Science Center, Chinese academy of Sciences. FAC s connecting the Ionosphere and Magneto sphere: Cluster and D ouble Star Observations. J. K. Shi, Z. W. Cheng, T. L. Zhang, M. Dunlop, Z. X. Liu. State Key Lab of Space Weather , NSSC /CAS , Beijing, China

E N D
NSSC National Space Science Center, Chinese academy of Sciences FACsconnecting the Ionosphere and Magnetosphere: Cluster and Double Star Observations J. K. Shi, Z. W. Cheng, T. L. Zhang, M. Dunlop, Z. X. Liu. State Key Lab of Space Weather, NSSC/CAS, Beijing, China Space Research Institute, AAS, Graz, Austria Rutherford Appleton Laboratory, UK ILWS/Beijing, August. 2011
Simutaneous Observations of Large • scale FACs
Cluster TC-1 TC-2 The Cluster and Double Star coordinate observation in geo-spac provide a good oppotunity to observe large scale FAC and it's properties. • 2004-09-14, 2 substorms took place • 2004-09-17, 1 substorm took plac3e
Here, we give the first time simutaneous observation for the large scale FACs connecting the I & M. • Before the DSP and Cluster cooperation, it was imposible for this observation.
2. Some FAC properties • Without the Cluster, the authors used By from one or two satellite to estimate the FAC. • With Cluster 4-point magnetic measurement, the "Curlometer Technique" was propsed to calculate the current
Lobe PlasmaSheet Lobe To research FACs with Cluster data in the PSBL In next part of this study, we use the Cluster magnetic field data taken in Plasma Sheet Boundary Layer (PSBL)to study FACs • 0.01< ß < 1 • The data from 4 satellites and FACs were calculated with Curlmeter • The data were obtained in 2001 For data quality:we take Q< 0.3
We selected the FAC cases to do statistical analysis: and time separation > 10 minutes Fig. 1b, FAC cases selected according to the plasma beta, FAC density and interval. All cases A, B, C, and D lie in the PSBLs, but the case C should not be selected because the current density is less than 3 pT / km and the interval of the case C and D is less than 10 minutes.
FAC’s asymmetry There are 172 FAC cases selected for this study: Fig. 2 FAC distribution on the Bx–By plane (left panel) that shows the FAC cases were only selected in the plasmasheet boundary layers, and the calculated FAC density distribution for all the cases (right panel) that shows FAC have a larger range of density values in the north hemisphere
Projection of FACs in X-Y plane • Red: Earthward, Blue: Tailward • Arrow Length: Density • Fig.3 FAC cases on the X-Y plane in the GSM system. It shows the FACs’s: • Dawn-Dusk asymmetry • Earthward –tailward asymmetry.
Dawn-Dusk asymmetry, Tailward-Earthward asymmetry (a) (b) Fig. 4 FAC distribution versus YGSM, gray and black colour mark the Earthward and tailward FACs respectively, (a) for the FAC cases number distribution and, (b) for the FAC fractional occurrence.
It is also possible that, in tail reconnection, a NENL may be eitherEarthward or tailward of the Cluster location. • In order to consider the R1 current system more directly, we use Bz to filter out any reconnection driven currents • Bz > 0, field lines connecting to the Earth. Bz<0, not. • 146 cases whose with condition Bz>0 were selected for the analysis.
Fig. 6a The footprints of the mapping of the FACs along the field line to the polar region. The left panel is for the northern hemisphere and the right panel is for the south hemisphere, respectively. The FAC cases in this figure exclude those with the condition Bz<0.
Fig.6b FAC footprint distribution versus latitude in the two hemispheres corresponding to Fig 6a, The left panel is for the northern hemisphere and the right panel is for the southern hemisphere, respectively. The FAC cases in this figure, of course, exclude those with the condition Bz<0.
FAC and geo-magnetic activity Fig.3. The FACs density as a function of Kp. The curve shows the FACs average density variation.
3. Summary The FACs connecting the I & M are studied by analyzing the data from DSP and Cluster 4-point measurement. The Main results are: ►The large scale FACs connecting the M and I are observed by the DSP and Cluster in 2004. It is the first time to observe the large scale FAC simutaneously. ►FACs not only have Earth-tailward asymmetry, dawn-dusk assymmetry, but also have north-south hemispheric asymmetry. ►FACs variation is consistant with Kp not AE.
NSSC National Space Science Center, Chinese academy of Sciences Thank you for attendance !