Download
1 / 23
230 likes | 377 Views
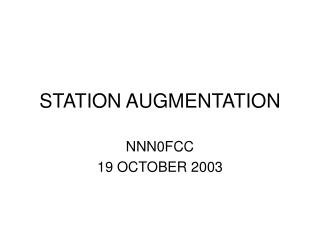
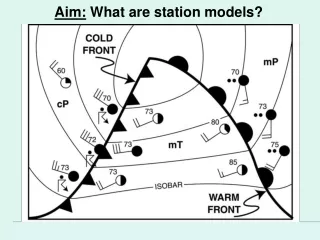
Station Models. and in the immortal words of Bob Wood, my high school Latin teacher…. Yajustgottaknow’um. page 13 of the ESRT. Temperature on the station model is displayed in degrees F. Cloud Cover. Temperature. Current Weather. 76. 138. Wind Direction & Speed. 4. Visibility. 3.

E N D
Station Models • and in the immortal words of Bob Wood, my high school Latin teacher… Yajustgottaknow’um
page 13 of the ESRT Temperature on the station model is displayed in degrees F
Cloud Cover Temperature Current Weather 76 138 Wind Direction & Speed . 4 Visibility 3\ 74 Dewpoint Barometric Trend Barometric Pressure
What did they do? 280 Removed a decimal and kept the 1st three numbers. 084
Barometric Pressure . 138 138 55 Add a decimal between the last two digits 13.8 Add a 9 or 10 in front to fit on the scale (ranges from 950.0 to 1050.0) 1013.8 mb
Add a decimal look to where it fits. 1028.1 1020.6 968.0
°F °F °F °F
°F °F °F °F
15) Which weather-station model shows an air pressure of 993.4 millibars?
Which weather-station model shows an air pressure of 993.4 millibars? Drop the decimal and keep the last three numbers.
How far can you see at station model D? 9 miles How far can you see at station model B? 2 miles
Station Models • Create a station model with the following data: • Temperature = 65ºF • Clear skies (no clouds) • Dew point = 55ºF • Wind is south at 15 knots • Barometric pressure = 984.3 mb • Barometric trend is a steady 2.3 rise. When you are doing wind direction draw in a compass if it helps. Just erase it at the end. N W E S
This is what it should look like: 65 843 +23/ 55
Which has the greatest probability of precipitation? First look at cloud coverage Then look for the station model that has the closest air temperature and dewpoint temperature
76 138 . 4 3\ 74