Download
1 / 31
310 likes | 404 Views
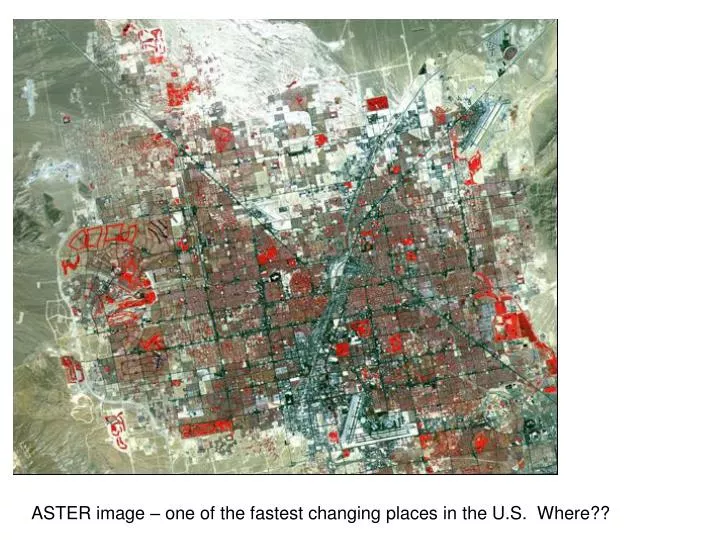
ASTER image – one of the fastest changing places in the U.S. Where??. USGS Image. Colors represent nature of change ( e.g ., more or less greenness, etc.). 2011 Minimum. 2011 Sea ice extent. Change Detection in Remote Sensing. Using multi-temporal satellite imagery to measure change.

E N D
ASTER image – one of the fastest changing places in the U.S. Where??
USGS Image Colors represent nature of change (e.g., more or less greenness, etc.)
2011 Minimum 2011 Sea ice extent
Change Detection in Remote Sensing Using multi-temporal satellite imagery to measure change
What is change detection? • The use of remotely sensed data to map the spatial extent and magnitude of changes on the land surface through time • Vegetation • Urban growth • Industrial development (e.g., gas wells, mines, etc.) • Coastal zone changes • Climate change effects (e.g., sea ice)
104 46W 042 08N 1976 – 2002 LAND COVER CHANGES
July 2002 April 2002
2002 1984
2000-Sep-10 1999-July-06
108 43W 041 45N 1984 – 2002 LAND COVER CHANGES
Basic Steps for Satellite-based Change Detection • Acquire multi-date imagery • Preprocess imagery (geometric, radiometric) • Apply change detection algorithm • Characterize change (transition matrices, visual interpretation, etc.) • Report results
Image Acquisition • Imagery must be available at least for start and end of change period (need to know satellite launch dates) • May require intermediate images for trends • Imagery should be of similar spatial, spectral, and radiometric resolution (not always possible) • Imagery usually should be from same time of year for each year
Preprocessing for Change Detection • Images must be carefully registered! • Map projection is important • Painstaking registration of each date to a “master” date • Atmospheric correction may be important
Change Detection Algorithms • Many strategies for manually or digitally mapping change from satellite (or aerial) imagery • Will discuss 5 commonly used methods, but there are variations and much room for creativity
Change Detection Techniques • Image algebra (differencing, ratios) • Post classification comparison • Change vector analysis • Visual interpretation of image stacks • Automated analysis of multi-date stacks (e.g., classification, PCA, etc.)
Image Algebra • Compare 2 or more dates using simple algebra • Subtract single bands or enhancements from two dates • Must select a threshold difference to separate real change from “noise” • Atmospheric differences between dates can cause problems • Interpret range of results (from large negative to large positive) in context of band or enhancement. • No change = 0, but this may be in middle (medium grey) of the possible range of outcomes.
Image Algebra (cont.) • Calculate the ratio of single bands or enhancements (e.g., NDVI) from each of 2 dates • No change = 1, change result can vary from very small (<<1) to very large (>>1). • Again, interpret in context of bands or enhancements
Land Cover Change in Pinedale Area from 1989 to 2006 using NIR Band only (2002 – 1989 NIR)
Post Classification Comparison • Classify (map) each image from different dates • Use comparable classification schemes and strategies • Use training areas that are stable (don’t change much between dates) • Classify both images • Compare the classifications • Generate “transition matrices” that are analogous to “error matrices” to analyze the types of changes that occur.
Pan-tropical area transition matrix for the period 1980-1990
Date 1 Date 2 Change vector analysis • Characterize direction and magnitude of vector depicting temporal movement of each pixel in feature space Band 4 Band 3
Change vector analysis USGS images
Image Display • Display a single band (or index) from each of 3 dates as red, green, and blue. • How will “no change” appear?? • How will changed areas appear?? • Not quantitative – but good for visual exploration of change • Requires 3 dates (can do with 2 but doesn’t work as well)
Change Stack for Pinedale anticline 1989 = Red 2002 = Green 2006 = Blue
Image “stack” of 1970s, 1980s and 2002 NDVI images colored R,G,B respectively. Why the green cast over the whole image?
Multi-date Compositing • Create a single image by stacking all the bands from two or more dates in one file • Use Supervised or Unsupervised classification, or other techniques (e.g. PCA) to create maps or “change bands” • Some classes or bands may correspond to changed pixels • Inefficient and hard to interpret
3rd principal component of stack of 1989, 2002, and 2006 NDVI
On-screen Digitizing • Put two image up on screen side by side and manually digitize areas that have changed • Only practical for small areas • Labor intensive • But…may work well for some projects
Change Detection IssuesThings to keep in mind for all of the algorithms • Atmospheric effects – may need to correct for atmospheric differences (and sun angle differences, etc.)! • Spatial error – must accurately register all of the image dates • Must consider other causes of change besides the ones you are interested in (e.g. wet vs. dry years, etc.)
Summary – Change Detection • Change detection is a very useful application of remote sensing—used a lot (= good job skill) • Various methods have strengths and weaknesses…choice depends on application • Important to control for changes that don’t relate to the change you are studying (e.g. atmospheric effects)