Download
1 / 11
110 likes | 231 Views
Journal Writing Warm-Up. Using the key: H = Hockey, B = Badminton, F = Football, each letter below indicates a student joining the sports club. H H B F B H F F H B B B H F H H F B H B a) Construct a frequency table for the data.

E N D
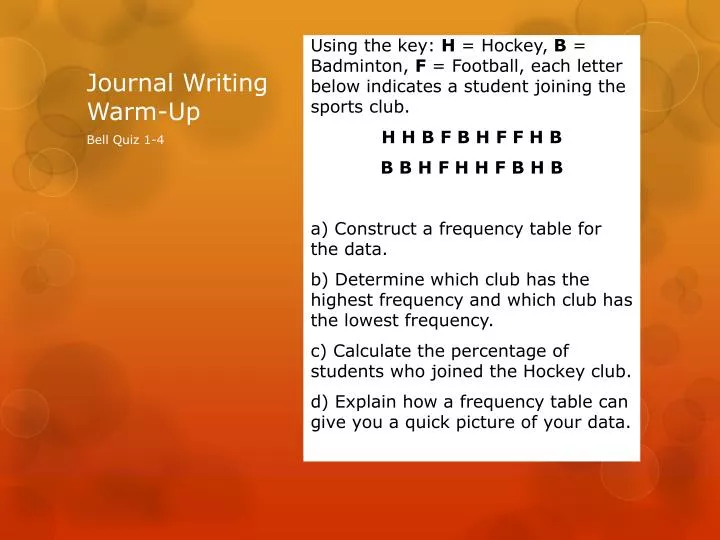
Journal Writing Warm-Up Using the key: H = Hockey, B = Badminton, F = Football, each letter below indicates a student joining the sports club. H H B F B H F F H B B B H F H H F B H B a) Construct a frequency table for the data. b) Determine which club has the highest frequency and which club has the lowest frequency. c) Calculate the percentage of students who joined the Hockey club. d) Explain how a frequency table can give you a quick picture of your data. Bell Quiz 1-4
This, That or the Other Using Frequency Tables to Examine Data
Words to Know • Categorical Data – • Conditional Relative Frequencies – • Joint Frequency– • Marginal Frequency – • Trends - • Two-Way Frequency Table -
Categorical vs. Numerical Data Data can be numerical or categorical. Try to figure out what each of the following are: • How many pets do students in our class have? • How many hours a week do we spend watching TV? • What is our favorite sport? • What kind of music do we like best? • How many hours a week do we talk on the phone? • What kinds of snacks do we like? • How much do our backpacks weigh? • How much candy do we eat each week?
What type of data we have determines how we examine it. Categorical Numeric Box and Whisker Plots Histograms Scatter Plots • Frequency tables • Dot Plots or pictographs • Bar Graphs
Extending Frequency Tables Frequency Tables can show more than just a total for each category. They can be extended to show relative frequency. Relative Frequency can be expressed as a fraction, decimal or a percent. ¼ .25 25%
Let try it. • Twenty students were asked how many hours they worked per day. Their responses, in hours, are listed below: • 5; 6; 3; 3; 2; 4; 7; 5; 2; 3; 5; 6; 5; 4; 4; 3; 5; 2; 5; 3 • Below is a frequency table listing the different data values in ascending order and their frequencies. Copy this table. • Calculate the Relative Frequency and write in a new column. C:\Users\sg\Pictures\2011-07-25_1546.png # of hours worked # of students in each category I’ll be coming around to check your work, then we’ll share!
What if we wanted to see how the hours worked data compares with the students test grade. To do this we can make a two-way frequency table to show the joint frequencies. Do you notice any trends in the data?
Marginal Frequencies are the totals of each row and column. Both totals must add up to the total number of students
So how do we look at the relative frequencies of a two-way freqency table? Ok, now you finish putting in the Conditional Relative Frequencies.
Homework Frequency Tables Worksheet