Download
1 / 34
350 likes | 499 Views
Air Quality Improvement Policies in Seoul. 2011 . 10. 25. Seoul Metropolitan Government. Contents. Introduction of Seoul Air Pollutants and Emissions Implementation of Air Quality Improvement Measures Expectations from Air Quality Improvement. 1. Introduction of Seoul.

E N D
Air Quality Improvement Policies in Seoul 2011. 10. 25 Seoul Metropolitan Government
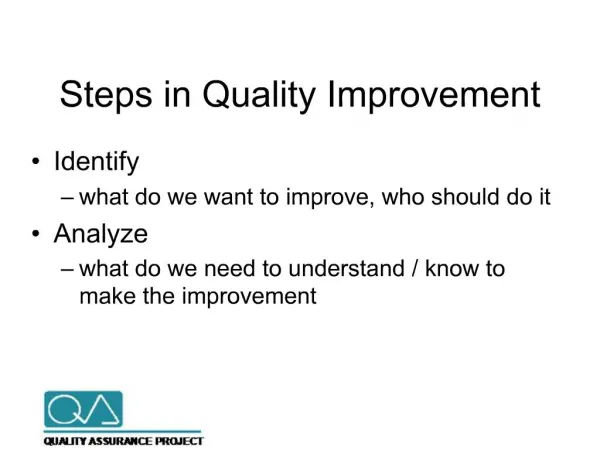
Contents • Introduction of Seoul • Air Pollutants and Emissions • Implementation of Air Quality Improvement Measures • Expectations from Air Quality Improvement
Urban Development & Air Pollution 980 2,500 Rapid social & economic development Capital city for around 600 years and political, economic, and cultural center of Korea Rapid urbanization – increase in population, number of houses and cars 10,620 2,970 1,430 10,440 1,190 460 8,360 2,400 206 70 (1960) (1980) (1990) (2010) (1960) (1980) (1990) (2010) (1960) (1980) (1990) (2010) Population (1,000 people) No. of Houses (1,000) No. of Vehicles (1,000) Air pollution problems emerged as a challenge in city affairs 1990:Particulate Matter - 150ug/m3, Nitrogen Dioxide - 0.03ppm, Sulfur Dioxide -0.051ppm
Current Air Quality in Seoul Comparison of air quality in Seoul and advanced cities Particulate matter in Seoul is 49ug/㎥, higher than Paris, New York and Tokyo. Nitrogen dioxide(0.034ppm) and sulfur dioxide(0.005ppm) in Seoul are lower than New York but they are still higher than other cities.
Particulate Matter (PM-10)&Fine Particles (PM-2.5) Emissions by pollution sources Fuel Combustion (2.8%) 362 ton Mobile Sources (22.4%) 2,894ton Bio-combustion (13.8%) 672 ton Fuel Combustion (6.6%) 322ton Emission 4,873ton/yr Bio-combustion (5.7%) 737ton Emission 12,923 ton/yr Mobile Sources (54.4%) 2,651ton Fugitive Dust (25.2%) 1,228 ton [Source: Research on particulate matter based on detailed monitoring of particles in atmosphere of Seoul, 2010] Fugitive Dust (69.1%) 8,930ton Fugitive dust accounts for the biggest share(69.1%) in PM-10 emissions PM-2.5 is usually emitted from mobile sources (54.4%)
Nitrogen Dioxide(NO2)&Sulfur Dioxide(SO2) Emissions by pollution sources Energy Industry 507ton (0.7%) Waste Treatment 486 ton (8.8%) Off-road Travel 514ton (9.3%) Waste Treatment 1,315ton (1.8%) Nonpoint Source 24 ton (0.1%) Energy Industry 4ton (0.1%) On-road Travel 114 ton (2.0%) Non-industrial Combustion 18,427ton (25.8%) Total Emissions 71,493ton Total Emissions 5,533ton Off-road Travel 6,915ton (9.7%) Manufacturing Combustion 61ton (1.1%) Manufacturing Combustion 814ton (1.1%) On-road Travel 43,491ton (60.8%) Non-industrial Combustion 4,354ton (78.7%) [Source: CAPSS data, Ministry of Environment, 2008] Mobile sources account for 70.5% of NO2emissions Non-industrial combustion accounts for 78.7% of SO2emissions - Anthracites and heavy oil consumption from residential and commercial facilities are the major contributors in non-industrial combustion
3. Implementation of Air Quality Improvement Measures
Reduction Policies by Pollutants Particulate Matter Reduction Promote low-pollution for diesel cars – Delivery of CNG cars; installation of DPFs, etc. Strengthen fugitive dust control – Control fugitive dust generation from roads and vacant space by conducting street water cleaning Nitrogen Dioxide Reduction Reduce traffic volume; deliver electric vehicles Increase NOx reduction efficiency at boilers – Supply low NOx burner Use eco-friendly energy – Supply renewable energy, promote energy efficiency Sulfur Dioxide Reduction Use fuels with little sulfur content – Change anthracites & heavy oil into gas External Cooperation Cooperate with neighboring cities – Strengthen cooperation system in Northeast Asian region (i.e. China, Japan, etc.)
Delivery of CNG Vehicle Reduction effects in pollutant emissions Comparison of pollutant emission levels between CNGbus & diesel bus (EURO Ⅴ) - Replacement of diesel buses with CNG buses reduce particulate matter and nitrogen oxides by 100% and 27.2% respectively
Delivery status Delivered 7,426 inner city buses (99%); 845 town shuttle buses; 468 garbage trucks Subsidize price difference between CNG anddiesel fuelled vehicles - 16~18.5million KRW per bus; 27~42 million KRW per garbage truck CNG infrastructure: 46stations, 2portable refueling facilities
Promotion of Low-Pollution for Diesel Vehicles in Operation Low-pollution for diesel vehicles, such as installing emission reduction devices: 225,704installed (as of Sep. 2011) • Installation of 70,732DPFs and 53,054DOCs; converted 66,108engines into LPG; encouraged early scrapping of 35,810cars • Provide subsidies to diesel vehicles in need of pollution reduction • Subsidize 90~95% of DPF installation costs; provide 80% of vehicle price for • scrapping the vehicle in advance [Diesel Particulate Filter] [Conversion of diesel car into LPG engine] Limiting operation of specific diesel vehicles (2011. 1) Outdated diesel cars without low-pollution devices are prohibited from operating in metropolitan area (4,070 cars)
Permanent Emission Regulation & Installation of Eco-Friendly Driving Device Permanent emission regulation • Development of regulation team • Operation of eco-friendly squad of 21 people; • 14 emission measurement devices • Achievements: On-site regulation of 1.7 million cars annually • - Fines or suspension of operation for 3,318cars ` Installation of eco-friendly driving device • Vehicles subject to installation: • Inner city buses, town shuttle buses • Installation status: 1,774buses • (subsidize0.88 million KRW per bus) • Effects • Prevent unnecessary idling while in operation • - Alarm sound will go off when driving Inefficiently (i.e. rapid start)
Encourage Public Transportation Use Enhance convenience of public transportation to reduce traffic volume • Introduction of median bus lanes: • 12arterial roads,length - 100km • Bus speed got faster by 4km/hr • Introduction of Bus Management System (BMS):Provide information about bus arrival time • Establish transit system for public transportation • Free transit of buses & subways within a certain • sector
Weekly No-Driving Day Program Citizen participation program limiting citizens from driving a car once a week • Number of participating cars: Around1 million cars • Incentivize participating cars • 5% discount on vehicle tax, 8.7% on car insurance (installed with OBD systems) • 50% discount on congestion fees when entering into city center • - Issue parking permits to residents living on side streets in residential area
Delivery of Electric Vehicles To be one of Global Top 3 EV leading cities by 2014 • Pilot operation • Commercial operation of electric buses (9buses in operation); test operation of electric cargo vehicles (2cars); charginginfrastructure (92charging points) • Delivery goal (by 2014) • Electric bus:Deliver 400 buses on short-distance lines (less than 25km) • Electric taxi:Deliver 1,000 taxis (battery swapping & plug-in types) • -Deliver 28,600electric cars, 10,000electric scooters • Charging infrastructure: • Install 8,000 charging points(126rapid chargers) • Establish infrastructure and relevant institutions by 2014 • to expand delivery of electric vehicles • Incentives for electric vehicles • 100% discount on congestion fees; • 50% discount on public parking lots • - Fixed rate of 130,000 KRW for vehicle tax • (Vehicle tax for passenger car: around 300,000 KRW)
Establishment of instructure to operate green cars Construct hydrogen station in World Cup Park by 2011.6 Hydrogen Station Fuel Cell Electric Vehicle Hydrogen fuel cell vehicles : Total 33 vehicles are in operation for official government use -travelling distance per charging : 650km, top speed : 160km/h Hydrogen station: Generate hydrogen using landfill gas (able to charge 30 vehicles per day) Projects for test operation of EV charging facilities (’09.11 ~ ’10.9) Projects for test operation of EV charging facilities(‘09.11~’10.9) Establish a system which can charge fees and recognize vehicle types to prepare for electric vehicle delivery in private sector Pilot production of electric vehicles, establishment of rapid and slow charging facilities for test operation Rapid charger (13 EA) Charging pole (17 EA) Home charger (62 EA)
Renewable Energy Supply Prohibit use of fossil fuel by using natural energy • Current status of renewable energy use • Renewable energy production: 207kTOE 1.8% of total energy use of 11,376 kTOE • Seoul Low Carbon Green Growth Master Plan(2009. 7) • - Plan to increase renewable energy consumption to 20% by 2030 Solar Power 0.9% Sewage Heat 5.7% Geothermal 0.9% Other 0.7% Solar Thermal 1.0% Bio 4.9% Bio 17.2% Total Production 2,632kTOE Total Production 207k TOE Fuel Cell 47.6% Waste 9.1% Fuel Cell 1.9% Geothermal 16.5% Solar Power 15.5% Waste78.7%
Energy Efficiency for Buildings Reduce pollutant emissions by improving energy efficiency • New buildings must receive Seoul Green Architecture Certificate • Newly constructed public buildings are obliged to receive 1st grade in Green Architecture Recognition Mark(2010) • - New private buildings (larger than 10,000㎡) are obliged to receive 1st grade in Green Architecture Recognition Mark by 2020 Encourage renewable energy use when approving construction plan • Implement Building Retrofit Project (BRP) for existing buildings • - Invest 85.9 billion KRW in 460 buildings by 2011 to improve facilities • Plan to invest 103.2 billion KRW in 850 buildings by 2014 • - Mandatory implementation of BRP for remodeling multi-tenant houses • Achievements • Seoul was recognized as a Leading City in BRP at C40 Seoul Summit held • in May 2009
Controlling Fugitive Dust Generation of fugitive dust Roads62.1% Fallow land20.2% Construction sites17.3% Other 39ton (0.4%) Construction Site 1,548ton (17.3%) Fugitive Dust Emissions 8,943ton Fallow Land 1,803 ton (20.2%) Road Generation 5,553ton (62.1%) [Source: Research on particulate matter features based on detailed monitoring of particles in atmosphere of Seoul, 2010]
Water-spraying and vacuum cleaning of roads • Water-spraying on roads • Total length: 8,093 km • Arterial roads (over 6 lanes):Once a day • Public roads (2~4lanes): Once in every two days • Side streets (less than 2 lanes):Once in every 2~3 days • Work at night-time (23:00~07:00) • Vacuum cleaning of roads • Vacuum clean the roads during winter time • when water-spraying is impossible • Own 14 vacuum cleaner trucks as of 2011 • (Plan to own 104 trucks by 2014) • Length of cleaned roads: 850,000 km (2011) • 1,700,000 km (2014)
Controlling fugitive dust from construction sites, vacant lots • Controlling construction sites • Dust generating sites: Total1,396sites • Installation of dustproof facilities: dustproof cover; textiles to prevent soil erosion, etc. • Controlling dust generation: Water-spraying; cleaning roads & wheels • Conduct monthly inspection to check whether sites are complying with regulations • Operation of resident inspection squad of 10 people
Controlling generation from vacant area • Create green space on leftover space in residential area: • 75 areas • - Encourage residents to spray water in front of their houses on days with high dust level • Controlling generation from schoolyards • Spraying dust suppression agent: 40schools every year • - Grass planting in schoolyards: 164 schools by 2014 • - Installation of sprinklers: 930schools(phased installation)
Delivery of Low NOx Burner Reduce NOx emissions by controlling flame temperature and oxygen concentration • NOxemission reduction • Gas burner: 53%, heavy oil burner: 83% • Devices subject to reduction:Replace regular boilers, water heaters and drying facilities • Implementation status: 1,565devices(14,929million KRW by 2011) • 1,450 devices by 2014 (deliver400~500devices every year) • Financial support • - 4.2 ~ 21 million KRW per device • (Around 90% of installation costs)
Fuel Change of Heavy Oil & Anthracites Replace fuels containing high sulfur dioxide content with clean fuels Other 7.1% • Sulfur dioxide generation from heating oil use at houses and buildings • Among 5,533 ton of total SO2 generation, • heating fuel of houses and buildings account for • 4,354 ton (78.7%) • - Anthracites and heavy oil are main contributors • Houses or small business use anthracites • Need to develop measures to support fuel change after • detailed identification of sources using anthracites • Heavy oil is commonly used in large buildings • Strengthen regulations on sulfur content in heavy oil (less than 0.3%) • Encourage facilities using heavy oil to replace fuel with diesel or city gas Heavy Oil 37.2% Anthracite 55.7% [4,354ton]
Global Cooperation to Improve Air Quality Regional contribution to particulate matter Non-Asia 10% Metropolitan area accounts for 41% of PM10 generation while North East Asia accounts for 39% of generation - Need to establish cooperation system to improve air quality in major North East Asian cities Metropolitan Area 41% Asia 39% Korea 10% [Source: Analysis result from air quality model (CAMx)] [Modeling analysis results using East Asian emissions and annual weather data]
Launch of Metropolitan Clean Air Council (May 2011) • Objective: To promote cooperation among 3 cities & provinces to improve air quality in metropolitan area • Role • Development and promotion of joint measures to address air pollution • Joint inspection on diesel vehicles violating low-pollution regulations; promotion of information exchange • Share air quality data with other local governments • Propose joint policies regarding air quality improvement to national government • Expectations • - Improve citizens’ quality of life by improving air quality in metropolitan area
Enhance environmental cooperation among NEA cities • Cities subject to participation • Korea(5): Seoul, Gyeonggi-do, Incheon, Chungcheongnam-do, Gangwon-do • Japan(4): Tokyo, Fukuoka, Hokkaido, Osaka • China(8): Beijing, Tianjin, Shandong Province, Jiangsu Province, Shanghai, • Zhejiang Province, Hebei Province, Liaoning Province • Implementation schedule • Prepare for establishment of a cooperation network & host a seminar • (2011. 9. 28) • Establishment of environmental cooperation network(2012) • Main agenda for cooperation • Exchange air quality improvement measures & best practices; promote joint implementation actions • Provide information on climate change policies • Cooperate and support researches on air quality improvement and • climate change
4. Expectations from Air Quality Improvement
Annual Air Pollutant Reductions Based on 2009 data [Source: Evaluation report on implementation of plans to improve metropolitan atmospheric environment, 2010]
Annual Air Pollutant Change Consistent reduction of PM-10, SO2, slight increase in NO2 Supply of low sulfur fuel and city gas in 1990s: Significant reduction of PM-10 and SO2 Supply of CNG buses, installation of DPFs since 2000: Consistent reduction of particulate matter Increasing cars on roads: Continuous increase of nitrogen dioxide
Air Quality Improvement Goal Achieve clean air by implementing air quality improvement policies consistently Achieve the level of Global Top 5 cities (i.e. Paris, Tokyo) in terms of air quality by 2020