Download
1 / 40
400 likes | 524 Views
Hanford Issues and Challenges: A Soils Perspective Kevin D. Leary, DOE-RL CPSS/Hydrogeologist/Hydrologist February 27, 2007. Agenda. Hanford History/Overview Clean-Up Challenges and Progress Overview of Hanford Soils/How Hanford Soils Affect Clean-Up Decisions ET Barriers

E N D
Hanford Issues and Challenges: A Soils Perspective Kevin D. Leary, DOE-RL CPSS/Hydrogeologist/Hydrologist February 27, 2007
Agenda • Hanford History/Overview • Clean-Up Challenges and Progress • Overview of Hanford Soils/How Hanford Soils Affect Clean-Up Decisions • ET Barriers • Permeable Adsorptive Liner (PAL) System • Conclusions
History • Established during World War II as part of the Manhattan Project, the site produced plutonium for nuclear weapons through the late 1980s • Produced ~74 tons of plutonium • Plutonium and uranium recovery • Operated 9 plutonium production reactors Reactor irradiation B Reactor Plutonium extraction and purification Fuel fabrication
Hanford Overview • 586 square miles • Adjacent to Tri-Cities community, population ~300,000 • Two federal offices at Hanford • Richland Operations Office • River Corridor and Central Plateau cleanup • Office of River Protection • Tank Farm cleanup • Transition to cleanup operations in 1989 • Workforce of ~7,000
Hanford Overview (cont.) • Oversight • Washington State Department of Ecology • Environmental Protection Agency • Defense Nuclear Facilities Safety Board • Tri-Party Agreement (TPA) outlines legally enforceable milestones for Hanford cleanup • Tribal Government consultation • Stakeholder involvement through the Hanford Advisory Board • Legacy contamination includes plutonium, strontium, technetium, uranium, other metals, and organic compounds
What we started with…. • 2,300 tons of deteriorating spent nuclear fuel • 18 tons of plutonium material • 1936 capsules of cesium and strontium • 80 square miles of contaminated groundwater • 25 million cubic feet of waste • 1,700 waste sites • 500 contaminated facilities – including five processing canyons and nine reactor complexes • 950 non-contaminated facilities/structures • More than 50 million gallons of tank waste in 177 underground storage tanks
River Corridor H D/DR N F ReactorAreas(100 Area) KE/KW B/C 200 West Area 200 East Area Energy Northwest 200 Areas 618-10 & 11 Burial Grounds 400 Area 300 Area Hanford Site Boundary (586 sq. miles) • Central Plateau(75 square miles) • Demolition of 950 structures/facilities • Remediation and closure of 850 Waste Sites • Remediate and clean up five Large Processing Canyons • Remediate and Treat four Groundwater Plumes • River Corridor(218 square miles) • Demolition of 510 facilities • Remediation and closure of 486 waste sites • Place four reactors into safe storage condition • Disposal operations: treatment, transportation, disposal (4 million tons of waste)
Hanford Overview Summary • Focus on activities that reduce risk • Remove/stabilize high-risk materials • Deactivate and decommission excessfacilities • Minimize long-term risks related to materials that will remain on-site • Work closely with regulators and the community to make decisions to guide and enable physical progress • Deploy comprehensive business approaches to improve performance • Working safely • Contract Acquisitions • Workforce transitions • Partnership – DOE, regulators, contractors, workforce, stakeholders and the community
Overview Of Hanford Soils • Soil Survey Hanford Project in Benton County, WA, BNWL-243 (PNL 1966) describes 15 different soil types. • Soil classifications and interpretations (e.g., surface impacts on recharge, re-vegetation after fire, etc) in this survey are outdated. • Parent material for the predominant soil types on the Hanford Reservation consists of the Hanford Formation and Holocene surficial deposits. • The primary depositional environments are glacial/fluvial and alluvial with minor components of eolian deposition. • Stabilized dunes are easily “re-activated” by surface-disturbing activities. • Active wind erosion made re-vegetation after the 2000 fire challenging. • Hanford Soils/unconsolidated vadose materials information will assist in: ET/recharge estimates; re-vegetation; contaminant transport; and overall remediation .
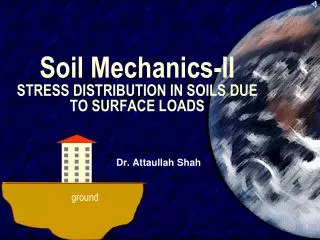
Overview of Evapotranspiration (ET) Barriers Proposed at Hanford • The primary objectives of barrier design are: • Maximize protection of human health and the environment by minimizing or eliminating percolation • Minimize or prevent inadvertent human and biological intrusion into the waste • Minimize radiation exposure at the surface from radioactive waste • Meet RCRA regulatory design life (30 years) and provisions of DOE Order 435.1 (500 to 1000 years) • In the past, EPA has developed two primary barriers for waste containment: • RCRA Subtitle D –Municipal Landfills • RCRA Subtitle C—Hazardous Waste Landfills • Problems with these two RCRA designs include: • Unknown durability of artificial materials • Cracking of bentonite clays under drying conditions • Differential settlement and/or shearing of layers due to subsidence or earthquake movement resulting in percolation of atmospheric waters into the underlying waste
Overview of ET Barriers (cont.) RCRA Subtitle D Surface Barrier
Overview of ET Barriers (cont.) RCRA Subtitle C Surface Barrier
Overview of ET Barriers (cont.) • Potential challenges associated with multi-layered barriers include: • More complicated to construct and maintain • Loss of performance if subjected to substantial subsidence and/or tectonic movement (ET barriers are “self-healing”) • Clays susceptible to cracking in arid/semi-arid climatic regimes • Long-term performance capabilities of manmade materials (e.g. HDPE, asphalt, etc.) • No “natural analog” demonstrating long-term performance like certain ET barrier natural analogs
Overview of ET Barriers (cont.) • The ET Barrier design builds upon lessons-learned from past and existing barriers. ET barriers rely on evapotranspiration and the water storage capacity of the soil as opposed to the RCRA barrier approach, which relies on a layer(s) with low water hydraulic conductivity to minimize percolation. • When precipitation exceeds ET, water is stored in the soil. When ET exceeds precipitation, soil water is removed. • An ET barrier should be of sufficient thickness to store moisture generated from extreme conditions (e.g., 100 or 500 year storm events with snow melt, projected climatic change conditions, etc.) that occur in the winter when transpiration is essentially zero and evaporation is minimal.
Overview of ET Barriers (cont.) • ET barriers are suitable for arid/semiarid regions with low to moderate annual precipitation, high ET, and a thick vadose zone overlying the groundwater. • In addition to the hydrologic objectives, optimum barrier properties include: • Preventing or mitigating intrusion • Minimizing erosion • Shielding radiation (for radioactive waste)
Overview of ET Barriers (cont.) • The two most common types of ET barriers are the Monolithic (Monofill ET), and the Capillary (Anisotropic) ET Barrier. • The Alternative Landfill Cover Demonstration (ALCD), led by Dr. Steven Dwyer-Sandia NL, evaluated six barriers: RCRA Subtitle C and D, Geosynthetic Clay Liner (GCL), Multi-layer Barrier, Capillary ET (Anisotropic), and a Monofill ET soil Cover. • The ALCD study documented that capital costs for the conventional RCRA Subtitle C barrier were more than twice the costs of an ET barrier and that O & M costs (over 30 years) for the RCRA C barrier were almost six times greater than the ET barrier. • The study concluded that, the Monofill ET and Capillary ET barriers out-performed the other four barrier types when considering overall barrier performance and costs.
Overview of ET Barriers (cont.) Monofill Evapotranspiration Barrier
Overview of ET Barriers (cont.) Capillary (Anisotropic) ET Barrier
Overview of ET Barriers (cont.) • ET barriers are gaining more and more acceptance in arid and semi-arid regions. • As of Sept. 2003, ET covers were proposed, tested, or installed at 64 sites located throughout the US • ET barriers are being evaluated and have been endorsed by the Interstate Technology and Regulatory Council (ITRC) in a published report called “Technology Overview Using Case Studies of Alternative Landfill Technologies and Associated Regulatory Topics” (March 2003).
Overview of ET Barriers (cont.) • General factors to consider when designing any barrier include: • Local Climate • Existing soil type and stratigraphy underlying the waste • Soil properties of the materials used for capping • Nature of the waste (e.g., physical and chemical properties) • Flora and fauna • Design challenges for ET barriers: • Intrusion • Climate change • Soil pedogenesis (soil formation) • Ecological changes • Erosion • Subsidence
Overview of ET Barriers (cont.) • Long-term barrier performance is a major concern. Methods to address this concern include : • Mimicking natural analog sites in barrier design • Rainfall simulations • Erosion studies • Modeling • Surface-armoring • Bio-intrusion layers • Development and implementation of M & O plans and institutional controls (e.g., deed restrictions, land-use zoning restrictions, posting/signage for mitigating human intrusion) • Barrier performance monitoring • Long-term monitoring can be achieved by using a combination of redundant systems (e.g., neutron tubes and time domain reflectometry [TDRs] detectors for measuring soil moisture, pan lysimeters, etc.),
Surface Barriers on Hanford’s Central Plateau • The total number that are candidates for surface barriers on the Central Plateau are unknown at this time. • The actual number of waste sites receiving barriers will only be determined after waste site characterization and the regulatory process (including input from tribal nations and stakeholders). • Some of the factors that will influence the decision to remove/treat/and dispose (RTD) versus barriers include: • Size of waste site • Depth of contamination • Type of contaminant • Location • Risk • Central Plateau Record of Decision for a Reprocessing Facility (221 U Facility or Canyon Disposition Initiative) selected close-in-place and an ET Barrier as the preferred remedial alternative.
ET Barrier Conclusions • There are numerous checks and balances involved during the decision-making and selection of a specific remedial alternative. These include: • regulatory approval • stakeholder and tribal input • adherences to the various applicable laws and regulations including the Nine CERCLA decision criteria • remedial action objectives and • preliminary remediation goals. • When new technologies are proposed, education, information exchanges, performance testing, and long-term monitoring will only enhance future acceptability of new approaches.
ET Barrier Performance Monitoring Systems Derived from Data Quality Objective (DQO) Process • Used the DQO planning process to optimize the approach for performance monitoring (i.e., vadose zone) of four U-Plant crib barriers: • The October 2004 meeting provided valuable information to DOE-RL for designing U Plant Crib barrier performance monitoring systems including details on: • Instrumentation • Type, number, and location of monitoring devices • Frequency of measurements
Performance Monitoring (cont.) • Identification of data limitations • System redundancy for long-term performance • Acceptance of monitoring systems • Employed the DQO process for developing a sound performance monitoring approach for the U-Plant barriers that will demonstrate barrier performance • Early regulatory participation in defining data needs and developing the preliminary design
Performance Monitoring (cont.) • Reviewed regulatory agencies input and concerns which included: • Statistical versus non-statistical sampling design • Pre-and post barrier construction soil moisture measurements • Bio-barriers to prevent plant/animal intrusion • Umbrella (edge effect)-the disproportionate amount of infiltration at the toe-slope of the barrier • Geotechnical characterization of the subsurface • Wildfire impacts on plants • Barrier longevity • Water routing with capillary break design • Lateral flow below the barrier
Performance Monitoring (cont.) • The U-Plant (221 U Facility) ET barriers will meet or exceed RCRA C barrier performance standards • Robust monitoring is needed to demonstrate performance and instill confidence in the first ET barriers on the Central Plateau • Based on natural analogs, these barriers should be functional for thousands of years
Performance Monitoring (cont.) • Consensus results for types, numbers, and locations of monitoring devices were as follows: • Drainage parameter: two 10’ X 10’ (minimum size) HDPE or geomembrane basin lysimeters located on leeside (toward bottom of slope) and crown of barrier • Water Storage: Three stations-six probes/station of Time Domain Reflectometry (TDR) at the crown, middle, and toe slope; and three translucent neutron access tubes emplaced horizontally at the base of the barrier or below the biointrusion layer (if warranted) and up to four vertical access tubes in the corners and/or near the TDR stations. Both instruments measure soil moisture content • Matric potential: Heat Dissipation Units (HDU)-Same location and # as TDR. Measures soil matric potential which can be used in quantifying the unsaturated hydraulic gradient
Performance Monitoring (cont.) • Precipitation, Wind and Temperature: AutomatedMeteorological station • Vegetation: Baseline field survey followed by remote sensing and periodic field verification • Elevation: Photogrammetry with baseline GPS and manual observations • Surface impacts: Visual observation for erosion, subsidence, and plant growth • Plant and Animal Intrusion: Visual surveys, manual radiological surveys, and utilization of a down-hole camera in the translucent, horizontal neutron access tubes (to look for the presence of roots below the biointrusion layer) • Animal Usage-Surficial: Visual surveys
Proposed Permeable Adsorptive Liner (PAL) • DOE-RL is considering the bench-scale testing and possible deployment of a permeable adsorptive liner (PAL), as a potential alternative to the traditional double-liner system for multiple reasons: • Life-cycle costs could be substantially lower than the standard double-lined system as there will be no leachate to treat and long-term monitoring requirements could be substantially reduced • Could significantly reduce the risk of post-closure vadose zone and groundwater contamination • Since there is no leachate to collect and treat, this approach will have a positive impact on any potential worker exposure issues • Enhanced regulatory acceptability for waste disposal
PAL (cont.) • Baseline liner for landfills is a double-lined HDPE or composite system with a leachate collection system • Permeable Reactive Barriers have historically focused on the Saturated Zone • A Permeable Adsorptive Liner (PAL) has been proposed as a candidate for further evaluation
Permeable Adsorptive Liner Waste Materials such as flyash, zeolite clay, various oxides and zero valent metals, granulated activated carbon (or finely crushed coal), phosphates, lime, and peat have all demonstrated their ability to strongly adsorb radionuclides and/or hazardous constituents
Steps to PAL Deployment • Phase I-Technical Validation of PAL concept- A technical peer review panel, composed of technical experts from the national laboratories, academia, industry, and the regulatory community met on August 5-6, 2003 to evaluate PAL feasibility and technical merit. The concept was validated and recommendations were to proceed with Phase II • Phase II—Bench-scale testing coupled with lessons-learned, evaluation of retention technologies for problem contaminants (e.g., Tc 99, modeling, and lab-scale hydraulic, geotechnical, and geochemical testing of PAL for LLW)- PAL development will focus on the data gaps in our current knowledge base.
Steps to PAL Deployment (cont.) • Experiments will assist in optimizing the physical, chemical, and geometric configuration characteristics of the PAL design in order to maximize long-term radionuclide and hazardous constituent attenuation. • Liner deployment costs should be minimized using the graded approach to PAL design in both the laboratory and field • The types, amounts, and configuration of the materials used in each PAL is dependent upon a variety of factors including waste composition (types and volumes), climate, and the results of the initial testing (i.e., modeling and lab/bench-scale testing)
Steps to PAL Deployment (cont.) • Total life-cycle costs and Return on Investment (ROI) of this R&D will be determined after the initial lab/bench-scale test results are completed. Phase III PAL Deployment • Deploy the PAL to document performance and regulatory acceptability • After multiple years of testing and validating PAL performance, pursue regulatory approval of PAL to MLLW and hazardous waste disposal operations
Potential PAL Benefits • Improved long-term waste containment performance • Enhanced Performance Assessment for the LLBG’s and may significantly decrease the amount of required waste pre-treatment (e.g., macro-encapsulation of certain waste prior to disposal) • Enhanced credibility for technology acceptance will be supplied by the independent, technical experts • Reduces total life-cycle costs for waste disposal • Potential for reducing landfill closure cover cost and long-term monitoring
Potential PAL Benefits (cont.) • Potential cost savings in avoiding groundwater or vadose zone contamination and subsequent costly remediation • Avoids the potential “bath-tub” affect of traditional double-lined systems • Eliminates leachate collection and treatment during the operating life of the facility since it is a passive system.
PAL Conclusion • Permeable reactive liners could be significantly cheaper to construct than the traditional double-lined system and may provide the ability to isolate waste for thousands of years • Materials used in a RCRA compliant double-lined facility are expected to fail long before the radionuclides have decayed • By optimizing the adsorption/attenuation processes via physical and chemical manipulation, the Permeable Adsorptive Liner could be a safe, viable, and cost-effective alternative for disposal of LLW, MLLW, and hazardous waste
Sources of Information on ET Barriers • Useful literature on ET barriers include • USEPA-USACE Draft (May 2004) Technical Guidance for RCRA/CERCLA Final Cover (Author of Chapter 3-”Alternative Design Concept and Materials-Dr. Stephen Dwyer-Sandia National Laboratories) • EPA Fact Sheet on ET Landfill Cover Systems (EPA 542-F-03-1-015—Sept. 03) • Several ITRC documents (see website listed below) • Selected Bibliographies Related to Evapotranspiration and Capillary Barrier Landfill Covers—by Kevin Leary • Useful websites for ET barriers: • www.itrcweb.org • www.epa.gov/superfund/new/evapo.pdf • www.rtdf.org To access the summary, click on the "Phytoremediation of Organics Action Team" Button, and then on the "Team Meetings" button.