Download
1 / 20
200 likes | 205 Views
Using Microsoft Excel. By Dr. Justin Bateh , Florida State College at Jacksonville & Dr. Bert Wachsmuth , Seton Hall University. What is Excel.

E N D
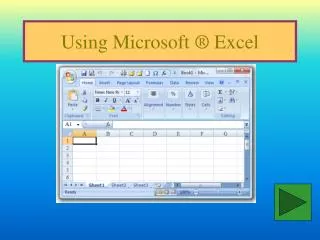
Using Microsoft Excel By Dr. Justin Bateh, Florida State College at Jacksonville & Dr. Bert Wachsmuth, Seton Hall University
What is Excel • Microsoft Excel is a spreadsheet program that can be used to enter data in tabular form and to perform a large variety of computations on that data. In addition, Excel can be used to create a wide range of graphical charts, and can even act as a simple database program to store, search, and retrieve data. Note: The instructions and screen shots that follow refer to Excel 2003. If you use a newer version (e.g. Excel 2007) you will find that most of the basic functionality is the same, but the menus and appearances are different. You could use the "Help" feature to find out how specific commands in the 'new' Excel relate to previous ways of doing them. For example, if you search "Help" for "Excel 2003" you will find an interactive "Excel 2003 to Excel 2007 command reference guide". You might find that guide helpful if you have any questions with the instructions below.
A file in Excel is called a "Work book", and each workbook can contain several "Sheets". A "sheet" is a table with rows and columns, where the rows are numbered and whose columns are labeled with letters from A to Z, then AA, AB, ... and so on.
Each cell in a table can contain text, numbers, or formulas, as well as more sophisticated types such as currencies, dates, etc. In addition, sheets can contain graphic elements such as charts that can be linked to values in specific cells.
The power of Excel comes from creating formulas that perform calculations on cells containing numbers. Every time a number involved in a formula changes, the resulting value of the formula also changes automatically. To see a simple example, download a sample Excel worksheet by clicking on the link below (but first read on a little more). click to open Microsoft Excel spreadsheet NOTE: If Excel does not automatically start, or you see a lot of strange characters instead, then right-click on the above link and save the document to your desktop. Then double-click on the downloaded icon to make Excel start. Either method will be okay for the remainder of the course. • If everything works, you will see a "live" spreadsheet in a separate window that looks similar to the video below. • Click on the cell B5 to see that it contains the number 80. • Click on the cell D8 to see that it contains a formula (in this case the SUM formula) • Change the data in cell B8 to 100 and press return. • Did the sum in cell D8 change? • Did the sum in cell D9 change? • Did the bar chart change? • When you are done, close the window that contains the spreadsheet. If you are asked whether to save your changes, select no. Make sure you know how to return to this document in your web browser.
Creating, Saving, and Retrieving Data • You can also start Microsoft Excel without clicking on a link. Here is a quick overview of creating, saving, and retrieving data: • To start Excel, click on the "Start" button and search for an entry labeled "Microsoft Excel". You might need to click "All Programs" to see that entry, or it might be located directly on your desktop. If you are using Windows 8, look on the "Start" screen for the Excel icon. • If you cannot find any of these entries, double click on the desktop icon "My Computer", then "Drive C" and then on the "Program Files" folder. If you double-click on a folder named "Microsoft Office" it should contain another folder named "Office10" or "Office 11" or "Office 12", which in turn will contain the "Excel" program. Double-click that Excel icon to start the program. Alternatively, if you are using Windows 8, swipe on the right side of the screen to bring up the Charms menu, tap Search, and type "Excel". • If you still cannot find Excel, you may not have the program installed properly, and you should call the help desk at extension x2222.
Practice: Start Microsoft Excel now. • Once Excel is open, you can enter data by clicking on a particular cell, then typing text, numbers, or formulas. If you move to another cell by clicking on it, your changes will be entered into the current cell. You can also: • hit TAB to enter your data and move the active cell to the right of the current one • hit ENTER to enter your data and move the active cell to the next row, usually to the beginning of that row • use the ARROW keys to enter your data and move the active cell in the indicated direction • hit END, LEFT-ARROW to move the first cell in a row • hit END, RIGHT-ARROW to move to the last cell in a row
Practice: What's the label of the last column in Excel? How many rows can an Excel spreadsheet contain? Move to the cell A1 and enter the numbers 10, 20, 30, 40, 50, 60, 70, 80, 90, 100, one number per cell, in the cells A1 to A10. • Excel tries to format your data based on what you enter. Numbers, for example, are right-aligned while text is left-aligned. To ensure that Excel treats your input the way you want it • if you start your input with a single quote ' it will be treated as text, even if you enter a number • if you start your input with an equal sign, it will be treated as a formula • Excel knows many formulas, and we will get to know some of them as our course progresses. For now, we will introduce the sum formula, which will compute the sum of all numeric entries in a specified range of cells.
Practice: Enter your name in cell A12. Enter the formula=sum(A1:A10) into cell A11, typing it exactly as shown. • You can save the data you worked on last just as in every other Microsoft Windows application (select File | Save or click the disk-like icon on the toolbar), and you can, of course, retrieve your data again any time. Please make sure to remember the folder in which you saved your data. Practice: Save the data you created (it should contain the numbers 10 through 100, their sum, and your name). • There is a lot more to know and learn about Excel. For additional details, you could take a course or workshop about Excel through CTC or TLTC, or you could work through the extensive Microsoft Office Help documentation available by selecting "Help | Microsoft Excel Help". If the "Office Assistant" shows up, click on "Options" and un-check the "Use Office Assistant" checkbox. Then select "Help | Microsoft Help" again to see a list of all available topics.
Calculations with Spreadsheet Data • Excel can perform a wide variety of operations with the data you entered, but in this course we will only need a small subset of all available functions. This section will explain - very quickly - how to enter some of the more commonly used functions. • There are many different methods in which Excel will let you perform the operations described here; we will usually give only one of the possible methods. If you already know a more efficient way to accomplish the same goal, use your method. • Example: Suppose I want to find the sum and the average of some tabular data, for each row separately. • First open Microsoft Excel and enter the data into the spreadsheet, as follows:
To compute the sum of the numbers in column C, proceed as follows (if you follow these instructions slowly and carefully it should work just fine): • We assume you have entered the number 10 to 90, as shown in the above picture. Now click on the cell C4 which is going to contain the sum of the numbers in the C column. • Type: =to indicate that this cell will contain a formula • After the equal sign, continue to type: sum(to specify that you want to use the summation function - make sure to include the open parenthesis ( • Now use the Up-Arrowkey to move the active cell to C3. Note that C3 will automatically be placed in your function • Hold down the SHIFT key and press the Up-Arrow twiceNow C1:C3 will be placed in your function • Complete the function by typing )(the closing parenthesis) and hit ENTER
You should now find the sum of the cells C1, C2, and C3 in cell C4. Instead of using the arrow keys in steps 4 and 5 you can also select the cells whose sum you want to find by "dragging" the mouse over them. In other words, you could also: • Click on the cell C4 which should contain the sum of the numbers in the C column. • Type: =to indicate that this cell will contain a formula • Continue typing: sum(to specify that you want to use the summation function - make sure to include the open parenthesis ( • Use the mouse to drag the cursor over the cells from C3 to C1.Now C1:C3 will be placed in your function • Complete the function by typing )(the closing parenthesis) and hit ENTER • which will accomplish the same task. Now your spreadsheet should look similar to the following:
Instead of enter the final two formulas into cells A4 and B4, we can now copy and paste the formula from cell C4. The range of the summation formula will automatically adjust to compute the sums of columns A and B, respectively. • Click on cell C4 • Select "Edit | Copy" or use the Control-C keyboard shortcut • Click on cell B4 and select "Edit | Paste", or use the Control-V keyboard shortcut • Click on cell A4 and again select "Edit | Paste", or use the Control-V keyboard shortcut
Excel offers many other functions that are interesting for statistical analysis, such as: • AVERAGE - Returns the average of its arguments • CHITEST - Returns the test for independence • CONFIDENCE - Returns the confidence interval for a population mean • CORREL - Returns the correlation coefficient between two data sets • COUNT - Counts how many numbers are in the list of arguments • COVAR - Returns covariance, the average of the products of paired deviations • FREQUENCY - Returns a frequency distribution as a vertical array • INTERCEPT - Returns the intercept of the linear regression line • LARGE - Returns the k-th largest value in a data set • MAX - Returns the maximum value in a list of arguments • MEDIAN - Returns the median of the given numbers • MIN - Returns the minimum value in a list of arguments • MODE - Returns the most common value in a data set • NORMDIST - Returns the normal cumulative distribution
PEARSON - Returns the Pearson product moment correlation coefficient • PERCENTILE - Returns the k-th percentile of values in a range • QUARTILE - Returns the quartile of a data set • RANK - Returns the rank of a number in a list of numbers • SKEW - Returns the skewness of a distribution • SLOPE - Returns the slope of the linear regression line • SMALL - Returns the k-th smallest value in a data set • STDEV - Estimates standard deviation based on a sample • TTEST - Returns the probability associated with a Student's t-test • VAR - Estimates variance based on a sample • ZTEST - Returns the two-tailed P-value of a z-test Practice: Compute the average of the numbers in columns A, B, and C (of course do not include the sums in the fourth row in your calculation). Make sure the average for each column is computed below the sum. Then format the sum and average numbers bold and italics.
Installing the Analysis Pack • Excel contains a variety of "add-ons" that allow you to perform additional calculations beyond the basic features build into Excel from the start. Some of these add-ons might require you to insert the Microsoft Office CD ROM, others can be installed without that disk. In general, the more add-ons you install into Excel, the longer the program takes to start up. Therefore you only want to install those options that you are really going to use, or uninstall add-ons when you don't need them any longer. • For this class you must install the "Analysis ToolPak", which contains a variety of procedures for conducting statistical analysis. Installing an add-on is simple, but differs slightly depending on your version of Excel.
Here is the procedure for the Analysis ToolPak for Excel 2007 • Start Excel as usual • Click on the "Office" button in the top left corner • Click on "Excel Options" next to "Exit Excel near the bottom of the menu
Highlight the "Add-Ins" option on the list on the left. Most likely the Analysis ToolPak add-in will show as inactive, as in the picture above. • Highlight the "Analysis ToolPak" in the list of inactive add-ins and click on the "Go ..." button at the bottom. You'll see another dialog box like this: • Make sure to check the "Analysis ToolPak" and click "OK". • Excel should ask you for confirmation. Agree and you're done (after the installation progress finishes, which will tke a minute or so).
You should not be prompted to insert a CD-ROM. If you do have to insert the Microsoft Office CD-ROM you should contact the Help Desk at x2222 for further assistance (unless, of course, you do have the CD-ROM ...) • The functions from the analysis toolpak will now be available in the "Data" ribbon on the right-most side, named "Data" (and not in the "Add Ins" ribbon as you might expect.
Check the ToolPak • The specific functions in that add-in are the same as for most versions of Office. If you select the "Data Analysis ..." option under "Data" you will see the following entries for performing statistical analysis on data in your spreadsheet: • We will explore several of these options in the rest of this course, but you are welcome to click on "Help" now to learn more about the Analysis Toolpak.