Download
1 / 21
210 likes | 216 Views
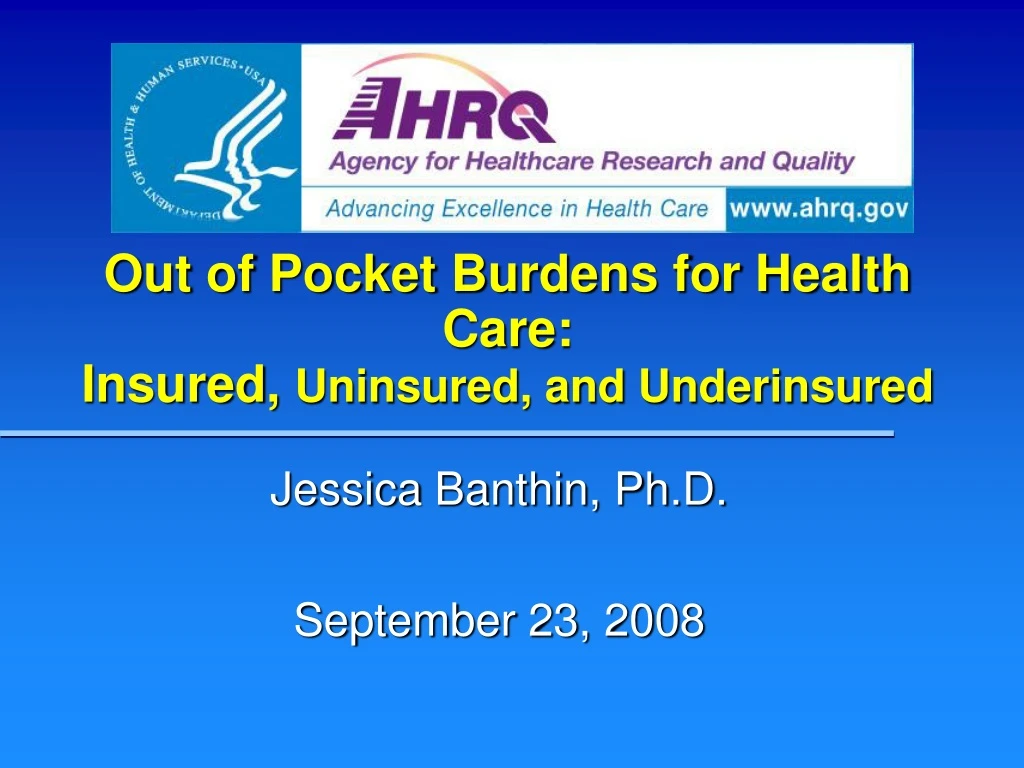
Out of Pocket Burdens for Health Care: Insured, Uninsured, and Underinsured. Jessica Banthin, Ph.D. September 23, 2008. Disclaimer.

E N D
Out of Pocket Burdens for Health Care: Insured, Uninsured, and Underinsured Jessica Banthin, Ph.D. September 23, 2008
Disclaimer The views expressed in this presentation are those of the author and no official endorsement by the Department of Health and Human Services or the Agency for Healthcare Research and Quality is intended or should be inferred. This presentation drawn from various papers, reflecting joint work with Dr. Didem Bernard and Dr. Thomas Selden of AHRQ.
Research Questions • How have rising health care costs affected family budgets? • How many individuals are underinsured? • How does risk of high out of pocket health care burdens vary by: • income status • insurance status • age and gender • presence of chronic conditions
Data:Medical Expenditure Panel Survey • The MEPS is annual survey sponsored by Agency for Healthcare Research & Quality • Nationally representative household survey consisting of 15,000 households and 39,000 individuals • Includes data on insurance coverage, health care utilization and expenditures, health status, medical conditions, & more • Most accurate source of nationally representative micro level data on out of pocket spending for medical care • Released on public use files, tables, statistical briefs: www.meps.ahrq.gov
Defining Underinsured • Numerator: We calculated total out of pocket spending across all individuals in the family • Denominator: We calculated total family income and adjusted for taxes • We identify individuals living in families that spend more than 10% of family income on out of pocket expenses – “underinsured” • Defined at family level because family members share resources and are affected by expenses of other family members
Family Level Out of Pocket Expenditures by Insurance Group, 2001 and 2005
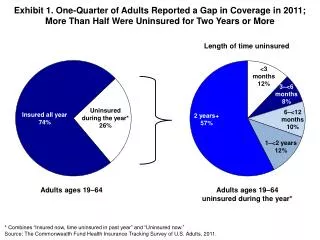
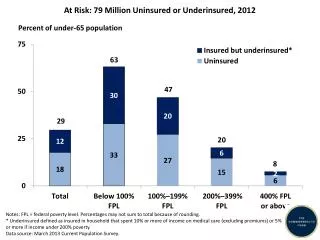
Number Underinsured, 2005 • About 15.8 million insured individuals were underinsured in 2005 using the 10% threshold • About 20.8 million were underinsured using a 5% threshold for persons below 200% of poverty and 10% threshold for others (Commonwealth Fund definition) • Small, but statistically significant increase from 2001.
What about premiums? • Out of pocket premium contributions are predictable and can be budgeted for, therefore they are not counted in the numerator for estimates of the underinsured • But – plans trade-off premiums and deductibles/copayments • Premium growth has been substantial
Defining Individuals with High Burdens for Total Spending • Numerator: We calculated total out of pocket spending across all individuals in the family • Include out of pocket premium payments in numerator • Denominator: We calculated total family income and adjusted for taxes • We identify individuals living in families that spend more than 10% of family income on out of pocket expenses – “high burden”
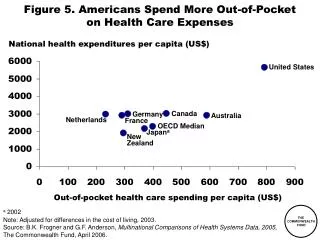
Financial Burdens by Chronic Disease 2003 Likelihood of facing high financial burden: • All persons, 19.2% • Diabetes, 39.1% • Stroke, 56.0% • Heart disease, 32.7% • Hypertension, 30.9% • Arthritis, 30.7% • Mental disorder, 29.2%
Conclusion • Both measures are useful for policy • Tracking trends in underinsured and high financial burdens provides policymakers with overview of issue • Identifies subgroups with elevated risk for high burdens • Helps inform debate on affordability issue • Also provides benchmark against which to measure proposed changes in policy