Download
1 / 45

E N D
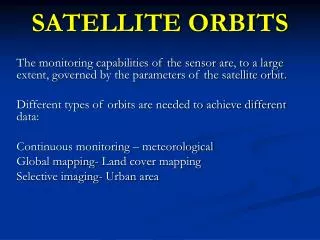
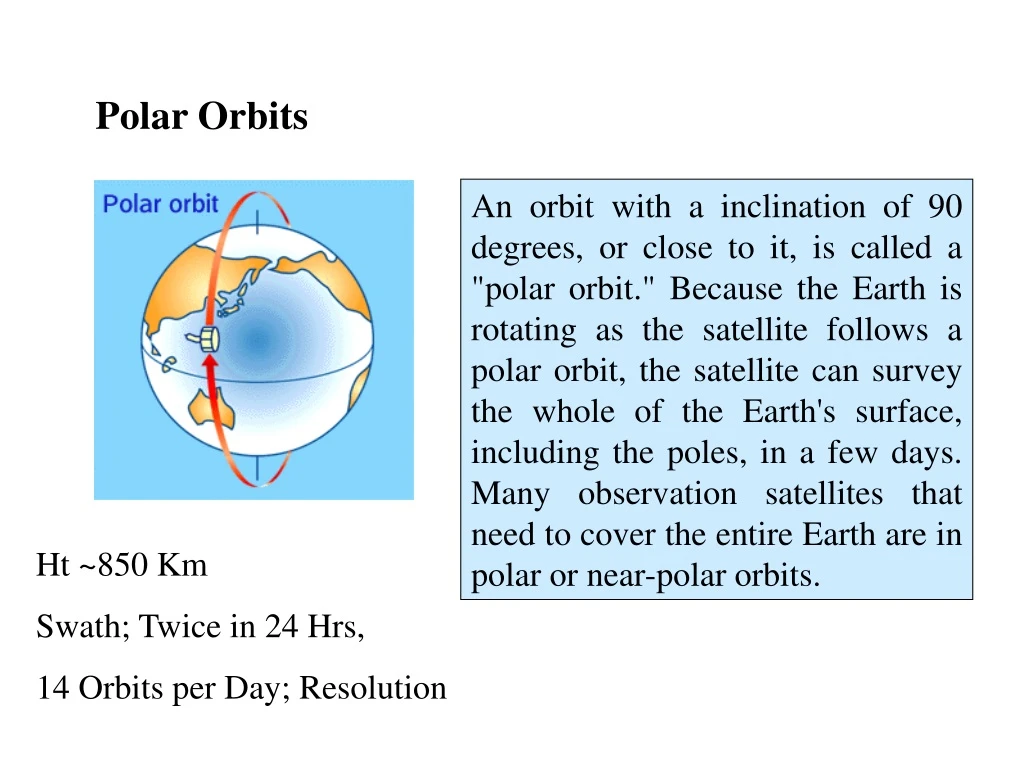
Polar Orbits An orbit with a inclination of 90 degrees, or close to it, is called a "polar orbit." Because the Earth is rotating as the satellite follows a polar orbit, the satellite can survey the whole of the Earth's surface, including the poles, in a few days. Many observation satellites that need to cover the entire Earth are in polar or near-polar orbits. Ht ~850 Km Swath; Twice in 24 Hrs, 14 Orbits per Day; Resolution
Sun-synchronous orbit: the satellite's orbital plane and the Sun's direction are always the same
Geostationary Orbit A satellite that appears to remain in the same position above the Earth is called a "geostationary satellite." Revolves with same angular velocity of earth Spatial Resol. –Less; polar regions not covered.
A satellite in a geosynchronous orbit goes around the Earth once a day returning to its original position
Types of Meteorological Satellite Sensors Imagers/Scanners Sounders Microwave Visible/Infrared 10^3 to 10^6 Micron 0.4-0.7 Micron, 1-100 Micron Passive (Radiometers/ Spectrometers) Active Radar LIDAR
Solar and Terrestrial Radiances Absorption Lines
Satellite imagery • VIS - imagery derived from reflected sunlight at visible • IR - imagery derived from emissions by the Earth and its atmosphere at thermal-infrared wavelengths • WV - imagery derived from water vapor emissions • 3.7μm - (channel 3) imagery from this specific wavelengths,which is in the overlap region between solar and terrestrial radiation
IMAGERY • METEOSAT • VIS • IR • WV • 3.7μm • 3.7μm-IR1 (split window) • GMS 5 • VIS • IR • WV • IR1-IR2 • (split window) • INSAT-3A • VIS • IR • WV • CCD (VIS,NIR,SWIR) • (split window)
NOAA-AVHRR • Polar orbiting Satellite • Resolution : 1.1 km (Nadir), 6 km Off Nadir) • Channels : Application • 0.55-0.68 Cloud Mapping • 0.75-1.1 Surface Water boundaries • 3.55-3.93 Thermal Mapping, Cloud distribution Fire detection • 10.3-11.3 Cloud distribution, SST,WV • 11.5-12.5 -do-
VIS image • Available only during daytime • Intensities vary depending upon locations among the earth, the sun and the satellite. • Reflection intensities differ depending upon cloud thickness. • Lower clouds can be seen well. 05UTC 17 Nov 1999 NOAA
TYPICAL ALBEDO VALUES • OCEAN / LAKES 8 % • LAND SURFACE 14 - 27 % • ICE 35 % • SNOW 80 % • CU CLOUD 30 % • CI CLOUD (THICK) 35 % • ST CLOUD 50 - 60 % • AC , AS & SC CLOUDS 68 % • TCU CLOUD 75 % • CB CLOUD 90 %
CHARACTERISTIC FEATURES • BRIGHTNESS ( WHITE, GREY ) • PATTERN ( LINE, BANDS, WAVES) • STRUCTURE ( SHADOW, HIGHLIGHT ) • TEXTURE ( SMOOTHNESS ) • SHAPE ( ROUND, STRAIGHT ) • SIZE (Patterns, useful indicators of Weather System
IR image • Always available • Shades of levels differ depending upon cloud heights (IR1, IR2). • Upper clouds can be seen well. 05UTC 17 Nov 1999 NOAA
WV image • Always available • Shades of levels differ depending upon humidity in upper to midlevel (WV). • Upper clouds can be seen well. • Levels may vary depending upon absorption by clouds and atmosphere on the way. 05UTC 17 Nov 1999 GMS
GMS 5 1200UTC 22 Oct 2000
CLOUD MATRIX I N F R A R E D DEEP CONV CB / TCU WHITE (COLD) DARK (WARM) THIN CIRRUS NO CLOUDS LOW CLOUDS DARK WHITE VISIBLE
GREY SCALE MATRIX WARM SEA BLACK DARK GREY GREY WHITE I N F R A R E D FAIR WX CU ST ST, SC AC, AS THIN CI THICK CI CB, TCU AS CB ANVIL WHITE GREY DARK BLACK GREY VISIBLE
IR1-IR2 • thin Ci • low cloud • volcanic ash, 05UTC 17 Nov 1999 NOAA
3.7μm image • Day time • (reflected sunlight) • snow • sea ice • Ci • Night time • (emmited radiation) • low cloud 05UTC 17 Nov 1999 NOAA
3.7μm-IR1 • Usage in night time • thin Ci • low cloud (Fog) 18UTC 9 Aug 1999 NOAA
.0 Some of the GOES Imagery Applications: Channel Channel Name Central Wave-length Resolutionkm E/W x N/S Example Meteorological Applications 1 visible 0.65 µm 0.57 x 1.00 Produces high resolution black and white photographs of earth and clouds. 2 shortwave infrared 3.90 µm 2.30 x 4.00 At night, can be used to track low-level cloud fields and thus infer near-surface wind circulation. 3 water vapor channel 6.70 µm 2.30 x 8.00 1. Detects mid- and upper-level water vapor and clouds. 2. Locates and defines synoptic features such as shortwave troughs, ridges, jet streams, etc. via mesoscale regions of moistening/drying at the 300-500 mb height. 3. Can derive upper-level wind vectors (wind barbs) with the winds plotted on the image valid at the time of the winds. 4 window channel 10.70 µm 2.30 x 4.00 Cloud top temperatures, nighttime tracking of storm systems. 5 dirty window/ split window IR 12.00 µm 2.30 x 4.00 Sensitive to low level water vapor.
Goes Imager Applications: • Channel 2, Short-wave Infrared Channel (3.9 µm) • Emissivity of water droplets at 3.9 µm is less than that for longer wavelengths, • Easier to identify fog and Stratiform cloudiness • Discriminate between water and ice clouds. • The 3.9 µm channel is different - emitted terrestrial radiation, and reflected solar radiation. • Fog, and cold ground. Combining this imagery with other channels resolves most of these problems. • Using Channel 2 (3.9 µm) Imagery at Night. • 3.9 µm imagery at night offers a good substitution for visible channel imagery • . It can be used to track low-level cloud fields and thus infer near-surface wind circulation. • useful in the tropics, where freezing levels are relatively high (~5 km) and conventional low-level wind data are sparse. • Channel 3, Water Vapor Channel (6.7 µm) • The 6.7 µm channel responds to mid- and upper-level water vapor and clouds. • large regions of upward (or downward) motion and consequent moistening (or drying), the water vapor data • used to locate short wave troughs, ridges, jet streams, etc. • Meso-scale regions of moistening/drying at the 300-500 mb height (such as subsidence associated with thunderstorms' anvils) have also recently come under close scrutiny using this channel's imagery Using Channel 3 (water vapor) Imagery to Derive Winds
IR1-IR2 and 3.7μm1997.11.7.05UTC NOAA IR1-IR2 3.7μm
SOLAR ECLIPSE emhanced VIS image VIS image 03UTC on 18 Mar,1988