Download
1 / 35
350 likes | 477 Views
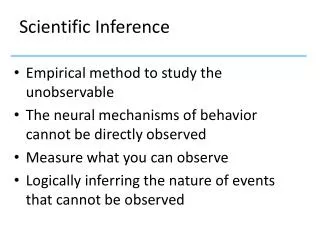
Chemistry – the science that deals with materials of the universe, and the changes that these materials undergo. Observation – something that is witnessed and can be recorded Inference – deriving a “logical conclusion” from premises known or thought to be true.

E N D
Chemistry – the science that deals with materials of the universe, and the changes that these materials undergo. Observation – something that is witnessed and can be recorded Inference – deriving a “logical conclusion” from premises known or thought to be true
Law – a statement that summarizes generally observed behavior. Gas laws Theory – an interpretation or possible explanation of why the universe behaves the way it does. Atoms, universe A law tells what happens, a theory is an attempt to explain why it happens.
Scientific Method – a systematic and logical way to approach problem solving • Problem/observations (collect data) • Hypothesis – a possible explanation for the observation • Experiment – tests hypothesis, repeatable, has a control, change only 1 variable at a time • Conclusion – a summary of results confirming/negating hypothesis
Law of Conservation of Mass/Energy – mass or energy can not be created or destroyed in a chemical reaction, it can only change forms. Physical Change – a change that does not involve the composition of an object Chemical Change – a change involving the composition of an object
Signs of a Chemical Reaction • Heat or light is given off • Gas is produced (bubbles form without heating) • A solid is formed • Water is produced or made in the reaction • A new substance is made
Physical or Chemical change • Ice melting • Cooking • Placing metal wire in acid • Placing Alka Seltzer in water • Tear paper • Boiling water • Boil potato
Physical Properties – properties that describe a substance without the substance changing (BP, MP, density, color, …) Chemical Properties – properties that describe how a substance reacts with another substance (sodium reacts with water, methane reacts with a flame,…)
Matter – anything that has mass and volume Substance – anything that is pure Element – a substance that can’t be simplified Compound – two or more elements that are chemically combined Mixture – two or more substances not chemically combined Homogeneous – similar or identical particles evenly distributed “looks the same” Heterogeneous – different particles unevenly distributed “looks different”
Classify each as an element, cmpd, homo/hetero mix Tap water aluminum air Polluted air store bought milk “whole” milk Sugar salt 14 K gold 24 K gold H2SO4 river water Salt water O.J. w/pulp ice & water Raw hamburger glass of Cherry Coke mercury Red Kool Aid cough medicine maple leaf Brass choc. chip cookie H2O2 Chunky peanut butter steel can of paint “bubble gum” medicine 1,3,5-trinitrotoluene
Ways to Separate a Mixture • Separation by hand • Filtration • Evaporation • Centrifuge • Chromatography • Distillation
How would you separate a mixture of: • Salt and water • Salt and sand • Water and alcohol • Clay and water • Different colors of ink • Blood
Qualitative Measurement – non numeric description of an object (color, size, hot/cold, …) Quantitative Measurement – numerical description of an object (12.5 cm, 14.2 g, …) Accuracy – how close the measurement is to the “right” or accepted answer Precision – how close the measurements are to each other Accuracy is not the same as precision
Scientific Notation – a way of showing very large or small numbers. 4.7 x 10³ 4.7 E 3 4.7 exp 3 4.7 x 10 x 10 x 10 = 4,700 The exponent or power tells how many places the decimal point will be moved. If the exponent is positive, the decimal point moves to the right, and the number is greater than 1. If the exponent is negative, the decimal point moves to the left, and the number is less than 1. The “number out front” is only allowed to have one nonzero digit to the left of the decimal point.
Write each of these using scientific notation 0.000325 4270 16.2 19,500,000 0.125 485 0.0417 0.0000093 Write each of these as a “regular” number 2.75 E 2 9.13 E-4 7.38 E-1 8.05 E3 7.76 E-3 5.35 E-2 1.48 E6 6.39 E1 2.34 E-2
Metric Units Mass – the amount of matter in an object, grams Volume – the amount of space an object occupies, liter Length – distance between two points, meter
Converting with metric units • M _ _ K H D _ d c m _ _ μ • Place 1 under starting prefix • Place 2 under ending prefix • Draw an arrow from 1 to 2. This is the direction to move the decimal point. • Count the number of places to go from 1 to 2. Be sure to count the __ spaces. • Move decimal point and rewrite number.
Make the following metric conversions 13.5 g kg 2.75 ml l 150 mm cm 0.0150 m cm 0.195 cg mg 0.750 l ml 2.46 mg kg 5.79 Hl l 7.53 Mm cm 0.0432 g μg 4150 cl μl 739 m μm 81.8 μg Mg 418.2 m km
Significant Figures (sig figs) – all known digits in a measurement plus one estimated digit. • Atlantic/Pacific Rule • If a decimal point is absent, count from the Atlantic (right) side starting with the first nonzero digit. • If a decimal point is present, count from the Pacific (left) side starting with the first nonzero digit • 508.0 820 0.0490 135 1000 • 1000. 1000.00 0.0300 1.30 E4 0.150
Defined or exact numbers have an infinite number of significant figures. Rounding off numbers: 0-4 drop, 5-9 add 1 Rounding numbers in calculations Add/subtract: the answer will have the same number of places past the decimal point as the measurement with the fewest places past the decimal point. Mult./divide: the answer will have the same number of sig figs as the measurement with the fewest number of sig figs.
When doing calculations, you round off when the following occurs: • When the rules for rounding change (going from add divide, mult add) • Get to the end of the problem, and you are giving the final answer.
Conversions that you are responsible for knowing 12 in = 1 ft; 3 ft = 1 yd; 5280 ft = 1 mile ( 1.00 in ~ 2.54 cm) 60 sec = 1 min; 60 min = 1 hr; 24 hr = 1 day, 7 day = 1 wk; 365.25 day = 1 yr 16 oz = 1 lb; 2000 lb = 1 ton ( 1.00 oz ~ 28.3 g) 8 oz = 1 cup; 2 cups = 1 pint; 2 pints = 1 quart 4 quarts = 1 gallon (1.00 oz ~ 29.5 ml)
Unit analysis/dimensional analysis/factor-label: A method of converting from 1 set of units to another set of units using a series of conversion factors. A conversion factor is a fraction made from the two parts of the equivalency. 12 in = 1 ft 1 ft/12 in or 12 in/1 ft Each equivalency can produce two conversion factors.
Convert 22 inches to feet • List possible conversion factors: 12 in/1 ft 1 ft/12 in • Set up grid with starting number and units in the upper left side: • 22 inches | = feet | • Plug in conversions so that the same units are on the diagonal • 22 inches | 1 ft= 1.8 ft | 12 inches
Use unit analysis: • 5.75 min month • 135 km cm • 17.5 oz gal • 1.5 mile inch • 145 years month • 135 yards km • 23.4 mL gal • 0.067 kg lbs
5.75 min month • 5.75 min 1 hr 1 day 1 yr 12 mos = 1.31 E-4 mos • 60 min 24 hr 365.25 day 1 yr • 135 km cm • 135 km 1000 m 1 cm = 13,500,000 cm • 1 km 0.01 m • 17.5 oz gal • 17.5 oz 1 qt 1 gal = 0.138 gal • 32 oz 4 qt • 1.5 mile inch • 1.5 mile 5280 ft 12 in = 95,000 in • 1 mile 1 ft
145 yrs 12 month = 1740 month 1 yrs 135 yds 36 in 2.54 cm 1 m 1 km = 0.123 km 1 yds 1 in 100 cm 1000 m 23.4 mL 1 oz 1 qt 1 gal = 0.00620 gal 29.5 mL 32 oz 4 qt 0.067 kg 1000 g 1 oz 1 lb = 0.082 lb 1 kg 28.3 g 16 oz
Density – a ratio of mass and volume of an object D = M/V M = D x V V = M/D Every pure substance will have its own characteristic density. This means that density can help identify a substance. Density of pure water = 1.000 g/ml When two objects with different densities are mixed: The object with the larger density sinks, The object with the smaller density floats.
A pure substance has a mass of 65.3 g and a volume of 75.0 ml. What is the density of the object, and what happens when it is put in water? • D = M/V 65.3 g/75.0 ml = 0.871 g/ml • Floats (density is less than water) • Mercury has a density of 13.6 g/ml. What is the volume of 745 g of mercury? • V = M/D 745 g/13.6 g/ml = 54.8 ml
Temperature – A measure of the average kinetic energy of the particles in a substance. Water boils: 100.0 oC Water freezes: 0.0 oC As the temperature goes up, particles start moving faster. As the temperature goes down, the particles move slower. There is a theoretical temperature at which all motion stops: ABSOLUTE ZERO = 0 K = -273 oC = -459 oF
Temperature scales oC K oF 0 273 32 100 373 212 37 310. 98.6 -273 0 -459 oC + 273 = KK – 273 = oC
Types of Graphs • Pie or Circle Graph: shows % or parts of the whole • Bar Graph: comparing two unrelated variables • Line Graph: comparing two related variables. This is the most common type of graph used in chemistry.
Graphing • X axis: east/west; independent variable; variable that you control • Y axis: north/south; dependent variable; variable that you don’t control • Title: Y vs X or Dependent vs Independent • Each axis should have a label indicating what you are measuring and the units (Mass, grams) • Each “box” on the axis has to be the same value. Pick “easy numbers” to label boxes.
Y axis boxes do not have to be the same value as the X axis boxes • Value of Box = Range of Values/#boxes • Data points must take up at least half of the graph paper. • All points must be on the graph. You are not allowed to “add boxes in the margin”. • Usually draw a single straight line through points, best fit line, not “dot to dot”. • Slope = Rise/Run = ΔY/ΔX = (Y2-Y1)/(X2-X1)