Download
1 / 18
180 likes | 406 Views
Exploring Exponential Growth and Decay Models. Sections 7.1 and 7.2. What am I going to learn?. Concept of an exponential function Models for exponential growth Models for exponential decay Meaning of an asymptote Finding the equation of an exponential function. Recall.

E N D
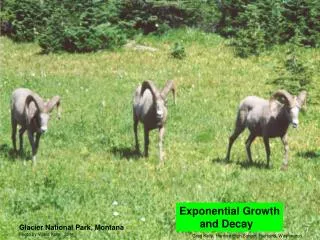
Exploring Exponential Growth and Decay Models Sections 7.1 and 7.2
What am I going to learn? • Concept of an exponential function • Models for exponential growth • Models for exponential decay • Meaning of an asymptote • Finding the equation of an exponential function
Recall • Independent variable is another name for domain or input, which is typically but not always represented using the variable, x. • Dependent variable is another name for range or output, which is typically but not always represented using the variable, y.
What is an exponential function? • Obviously, it must have something to do with an exponent! • An exponential function is a function whose independent variable is an exponent.
x y=ab Dependent Variable Exponentand Independent Variable Just some number that’s not 0 Why not 0? Base What does an exponential function look like?
The Basis of Bases • The base of an exponential function carries much of the meaning of the function. • The base determines exponential growth or decay. • The base is a positive number; however, it cannot be 1. We will return later to the reason behind this part of the definition .
Exponential Growth • An exponential function models growth whenever its base > 1. (Why?) • If the base b is larger than 1, then b is referred to as the growth factor.
Cool Fact:All exponential growth functions look like this! What does Exponential Growth look like? Consider y = 2x Table of Values: Graph:
Investigation: Tournament Play • The NCAA holds an annual basketball tournament every March. • The top 64 teams in Division I are invited to play each spring. • When a team loses, it is out of the tournament. • Work with a partner close by to you and answer the following questions.
Investigation: Tournament Play • Fill in the following chart and then graph the results on a piece of graph paper. • Then be prepared to interpret what is happening in the graph.
Exponential Decay • An exponential function models decay whenever its 0 < base < 1. (Why?) • If the base b is between 0 and 1, then b is referred to as the decay factor.
Cool Fact:All exponential decay functions look like this! What does Exponential Decay look like? Consider y = (½)x Graph: Table of Values:
End Behavior • Notice the end behavior of the first graph-exponential growth. Go back and look at your graph. as you move to the right, the graph goes up without bound. as you move to the left, the graph levels off-getting close to but not touching the x-axis (y = 0).
End Behavior • Notice the end behavior of the second graph-exponential decay. Go back and look at your graph. as you move to the right, the graph levels off-getting close to but not touching the x-axis (y = 0). as you move to the left, the graph goes up without bound.
Asymptotes • One side of each of the graphs appears to flatten out into a horizontal line. • An asymptote is a line that a graph approaches but never touches or intersects.
Asymptotes • Notice that the left side of the graph gets really close to y = 0 as . • We call the line y = 0 an asymptote of the graph. Think about why the curve will never take on a value of zero and will never be negative.
Asymptotes • Notice the right side of the graph gets really close to y = 0 as . • We call the line y = 0 an asymptote of the graph. Think about why the graph will never take on a value of zero and will never be negative.
ExamplesDetermine if the function represents exponential growth or decay. 1. 2. 3. Exponential Growth Exponential Decay Exponential Decay