Download
1 / 26
260 likes | 393 Views
Landau, Poland, Norway. field work, experiments Task D. Poland, Szczecin. 4 ditches 10 Sampling Stations Application on corn: 28.05.2007 Mesotrione (H) Nicosulfuron (H) Atrazine (H) Application on wheat: 25.04.2007 Fenpropimorph (F) Prochloraz (F) 28.05.2007 Propiconazole (F)

E N D
Landau, Poland, Norway field work, experiments Task D
Poland, Szczecin • 4 ditches • 10 Sampling Stations • Application on corn: • 28.05.2007 • Mesotrione (H) • Nicosulfuron (H) • Atrazine (H) • Application on wheat: • 25.04.2007 • Fenpropimorph (F) • Prochloraz (F) • 28.05.2007 • Propiconazole (F) • Fenpropidin (F) • samples: • 28.05, 30.05, 07.06, 10.06, 12.06
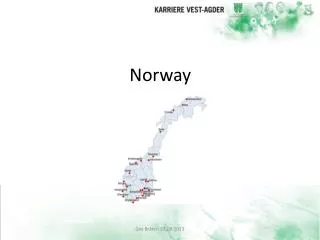
Norway, Lierdammen • July, August 2008: • -Experiment with • Common pesticides • Preparation started
Monitoring Landau: Substances 2007 Analysis: 10 Fungicides 2 Herbicides and 4 Insectizides Detection: All Substances except two Insecticides were detected
Monitoring Landau: Substances 2007 Analysis: 10 Fungicides 2 Herbicides and 4 Insectizides Detection: All Substances except two Insecticides were detected Concentrations: mean total in stream Concentration (runoff events): 1205 µg/l TU=C/EC50
Monitoring: Toxicity TU=∑(CSubstance/EC50Substance) Lieselgraben 20.07.2007 TUAlgae_max =7.28 Kropsbach: 31.07.2007 TUDaphnia_max =7.13
Outlook 2008 Field Jul - Sept: Experiments Jul - Nov: Krottenbach (VD, DP) Lier (EW) Hainbach (VD, DP) Landau (ED) Kropsbach (DP) Methods: Samples: Water, Suspended Sediments, Plants, ground Sediments Measurement of oxygene, pH, conductivity, N and P Discharge: Water level loggers Leaf decomposition bioassays (VD, DP) Mapping of runoff and drainage entries (VD)
Task H APPLICATION: SIMULATION AT EU-LEVEL
synopsis Objective: The application of the prototype mitigation techniques to selected regions in the EU will be simulated in order to assess the mitigation potential as well as the financial implications Models Steps: 1. definition of reference areas ArtWET sites 2. selection of a suitable model REXTOX ? 3. simulation at reference areas Exposure at point, mitigation runoff only available local geodata / free EU geodata 4. simulation at EU-scale existing risk maps (footprint…?) free EU-geodata 5. estimation of application costs and environmental impact
Input • Geodata • SRTM Elevation • CORINE Landcover • EUjrc Octop, soil texture • Precipitation • CCM2 waterbodies, watersheds, points • Pesticide data • Footprint PPDB
REXTOX Model • Model (modified Reus et al., 1999) • Outtake per Hektar Pc(g/ha) 10x10m Cellsize: • Pc = (Q/P) * e (- 3 * ln (2) / DT50soil )*(1/(1+(KOC * %OC/100))) * (1 – I/100) * f 1slope * f 2bufferzone * Pa*1000 • Q: Runoff amount (Lutz 1984 und Maniak1992) • P: Precipitation [mm] • DT50soilhalflife soil • KOC : partition coefficient in the organic fraction of the soil • OC: Organic Carbon in topsoil [%] • I: Plant interception • f 1slope : factor of slope • f 2bufferzone: widh of vegetated bufferzone • Pa: Application amount in [g/ha]
Model part 2 Calculation of the In stream concentration at the sampling point T = (DH /Vrunoff)/60 DH: Hydrological distance [m] of each cell to the sampling point Vrunoff:flow velocity [m/s] T: flowtime from cell output to sampling point as Integer [minutes] MT = Sum of the Mcell with the same T Integer MT: output mass of the cells with the same arrival minute [g] Mcell: absolute mass per cell [g] CT = MT /Qstream CT: In stream concentration of Timestep Qstream: Peak stream flow during rain event [l/minute] The highest CT value describes the peak concentration at T minutes after begin of the Runoff event
Hainbach simulation: study area Hainbach Spring in thepalatineanforest Catchmentofdetentionponds : appr. 585 ha 76 ha intensive winegrowing 25 majorrunoffanddrainageentriesfromvineyards Sampling stationsupstreamanddownstreamofthree consecutive flow through vegetated detention ponds
HainbachMonitoring: Tebuconazole Runoff Events with Precipitation > 10 mm/m² Focus Substance: Tebuconazole - present in all water and sediment samples (Cmax =326 µg/l) - highest average concentration in both years (Cav=136.7 µg/l) - Average retention = 56%
Hainbach simulation: Step 2 Rain event of 19 mm/m² three days after Application Application rate of 300 g/ha Tebuconazole Simulated Peak at the Sampling station 35 minutes after begin of the rain event Cmax 275 µg/l Tebuconazole
Hainbach Synopsis In Stream Concentrations show considerable pollution of the monitored surface waterbodies with acute toxic effects to aquatic organisms Daphnia EC50: 7.13 TUmax Algae EC50: 7.28 Tumax mean total in stream Concentration (runoff events): 1205 µg/l Wetlands have a potential to mitigate agricultural nonpoint-source pollution entering surface waters via spray drift or runoff First results show feasibility of GIS based Runoff Simulation with widely available Geodata: Measured: Cav = 137 µg/l Tebuconazole Cmax = 326 µg/l Tebuconazole Simulated: Cmax = 275 µg/l Tebuconazole
At issue… Simulation at EU level Own simulation existing Risk maps Runoff runoff, drainage, Spray drift Good resolution coarse resolution Best recent geodata Regional Climate not included Combined approach: - Identification of Areas with high risk from existing risk maps - Exposure Simulation of those areas with best recent geodata (GIS) - Simulation of Mitigation (GIS) - Upscaling estimation of application costs and environmental impact