Download
1 / 3
30 likes | 169 Views
PHARMACIST-MANAGED DIABETES SERVICE IN A RURAL FREE CLINIC Katherine R. Gerrald, PharmD 1,2,3 ; Julie M. Sease, PharmD 1,2 ; Meg Franklin, PharmD , PhD 1 1. Presbyterian College School of Pharmacy 2. Good Shepherd Free Medical Clinic 3. St. Luke’s Free Medical Clinic. Background. Results.

E N D
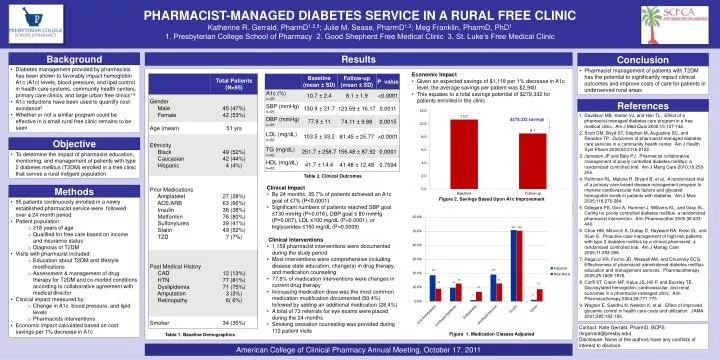
PHARMACIST-MANAGED DIABETES SERVICE IN A RURAL FREE CLINIC Katherine R. Gerrald, PharmD1,2,3; Julie M. Sease, PharmD1,2; Meg Franklin, PharmD, PhD1 1. Presbyterian College School of Pharmacy 2. Good Shepherd Free Medical Clinic 3. St. Luke’s Free Medical Clinic Background Results Conclusion • Diabetes management provided by pharmacists has been shown to favorably impact hemoglobin A1c (A1c) levels, blood pressure, and lipid control in health-care systems, community health centers, primary care clinics, and large urban free clinics1-8 • A1c reductions have been used to quantify cost-avoidance9 • Whether or not a similar program could be effective in a small rural free clinic remains to be seen • Pharmacist management of patients with T2DM has the potential to significantly impact clinical outcomes and improve costs of care for patients in underserved rural areas • Economic Impact • Given an expected savings of $1,118 per 1% decrease in A1c level, the average savings per patient was $2,940 • This equates to a total savings potential of $279,332 for patients enrolled in the clinic References Davidson MB, Karlan VJ, and Hair TL. Effect of a pharmacist-managed diabetes care program in a free medical clinic. Am J Med Qual 2000;15:137-142. Scott DM, Boyd ST, Stephan M, Augustine SC, and Reardon TP. Outcomes of pharmacist-managed diabetes care services in a community health center. Am J Health SystPharm 2006;63:2116-2122. Jameson JP and Baty PJ. Pharmacist collaborative management of poorly controlled diabetes mellitus: a randomized controlled trial. Am J Mang Care 2010;16:250-255. Rothman RL, Malone R, Bryant B, et al. A randomized trial of a primary care-based disease management program to improve cardiovascular risk factors and glycated hemoglobin levels in patients with diabetes. Am J Med 2005;118:276-284. Odegard PS, Goo A, Hummel J, Williams KL, and Gray SL. Caring for poorly controlled diabetes mellitus: a randomized pharmacist intervention. Ann Pharmacother 2005;39:433-440. Choe HM, Mitovich S, Dubay D, Hayward RA, Krein SL, and Vijan S. Proactive case management of high-risk patients with type 2 diabetes mellitus by a clinical pharmacist: a randomized controlled trial. Am J Manag Care 2005;11:253-256. Ragucci KR, Fermo JD, Wessell AM, and Chumney ECG. Effectiveness of pharmacist-administered diabetes mellitus education and management services. Pharmacotherapy 2005;25:1809-1816. Cioffi ST, Caron MF, Kalus JS, Hill P, and Buckley TE. Glycosylated hemoglobin, cardiovascular, and renal outcomes in a pharmacist-managed clinic. Ann Pharmacotherapy 2004;28:771-775. Wagner E, Sandhu N, Newton K, et al. Effect of improved glycemic control in health care costs and utilization. JAMA 2001;285:182-189. Objective • To determine the impact of pharmacist education, monitoring, and management of patients with type 2 diabetes mellitus (T2DM) enrolled in a free clinic that serves a rural indigent population Table 2. Clinical Outcomes • Clinical Impact • By 24 months, 35.7% of patients achieved an A1c goal of ≤7% (P<0.0001) • Significant numbers of patients reached SBP goal ≤130 mmHg (P=0.016), DBP goal ≤ 80 mmHg (P=0.007), LDL ≤100 mg/dL (P<0.0001), or triglycerides ≤150 mg/dL (P=0.0009) • Clinical Interventions • 1,159 pharmacist interventions were documented during the study period • Most interventions were comprehensive including disease state education, change(s) in drug therapy, and medication counseling • 77.6% of medication interventions were changes in current drug therapy • Increasing medication dose was the most common medication modification documented (50.4%) followed by adding an additional medication (28.4%) • A total of 73 referrals for eye exams were placed during the 24 months • Smoking cessation counseling was provided during 112 patient visits Methods Figure 2. Savings Based Upon A1c Improvement • 95 patients continuously enrolled in a newly established pharmacist service were followed over a 24 month period • Patient population: • ≥18 years of age • Qualified for free care based on income and insurance status • Diagnosis of T2DM • Visits with pharmacist included: • Education about T2DM and lifestyle modifications • Assessment & management of drug therapy for T2DM and co-morbid conditions according to collaborative agreement with medical director • Clinical impact measured by: • Change in A1c, blood pressure, and lipid levels • Pharmacists interventions • Economic impact calculated based on cost savings per 1% decrease in A1c Contact: Kate Gerrald, PharmD, BCPS (krgerrald@presby.edu) Disclosure: None of the authors have any conflicts of interest to disclose. Figure 1. Medication Classes Adjusted Table 1. Baseline Demographics American College of Clinical Pharmacy Annual Meeting, October 17, 2011
TITLE OF PRESENTATION/POSTER GOES HERE Names of the people presenting go here, along with professional titles Names of collaborating institutions go here Optional Conference logo here, or delete Background Results Conclusion • Insert background information here • Here • Here • Here • Insert Conclusion Information Here • Graph Example 1 • Information about the Graph 2 • Information about Graph 2 References Insert Reference List here Here Here Here Here Here Here Here Here Here Here Here Here Here Here Here Objective • Insert Objective Information here • Here • Here • Here Table 2. Name of Table 2 • Interesting Findings • Information here • Here • More Findings • List of more findings • List of more findings • More findings • More findings • More findings • More findings • More findings • More findings • More findings Methods Figure 2. Name of Graph 1 • Insert Methods here • Here • Here • Here Contact: Contact Information here Disclosure: None of the authors have any conflicts of interest to disclose. Figure 1. Name of Graph 2 Table 1. Name of Table 1 Insert Conference Name Here, Date/Year
TITLE OF PRESENTATION/POSTER GOES HERE Names of the people presenting go here, along with professional titles Names of collaborating institutions go here Optional Conference logo here, or delete Background Results Conclusion • Insert background information here • Here • Here • Here • Insert Conclusion Information Here • Graph Example 1 • Information about the Graph 2 • Information about Graph 2 References Insert Reference List here Here Here Here Here Here Here Here Here Here Here Here Here Here Here Here Objective • Insert Objective Information here • Here • Here • Here Table 2. Name of Table 2 • Interesting Findings • Information here • Here • More Findings • List of more findings • List of more findings • More findings • More findings • More findings • More findings • More findings • More findings • More findings Methods Figure 2. Name of Graph 1 • Insert Methods here • Here • Here • Here Contact: Contact Information here Disclosure: None of the authors have any conflicts of interest to disclose. Figure 1. Name of Graph 2 Table 1. Name of Table 1 Insert Conference Name Here, Date/Year