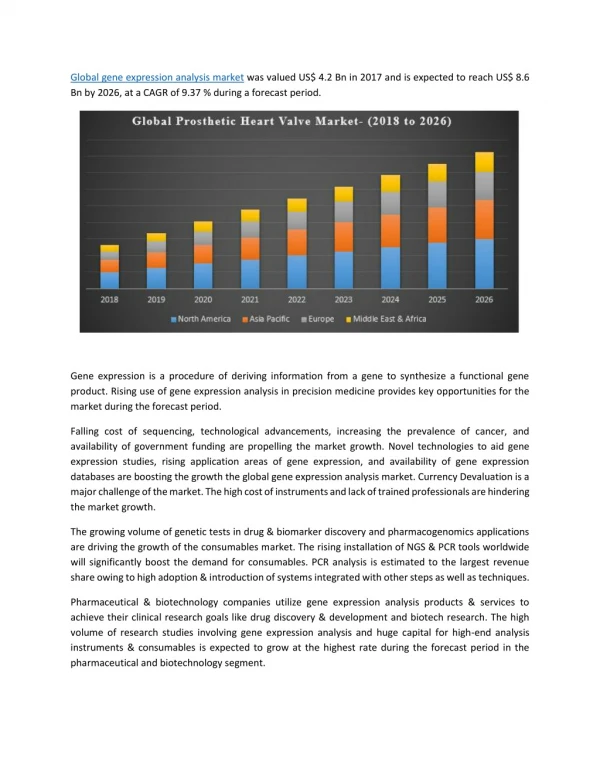
Download
1 / 38
400 likes | 529 Views
Gene Expression Analysis. Gene Expression. protein. RNA. DNA. Gene Expression. AAAAAAA. AAAAAAA. AAAAAAA. AAAAAAA. AAAAAAA. AAAAAAA. AAAAAAA. AAAAAAA. AAAAAAA. mRNA gene1. AAAAAAA. AAAAAAA. AAAAAAA. AAAAAAA. AAAAAAA. mRNA gene2. AAAAAAA. AAAAAAA. AAAAAAA. AAAAAAA.

E N D
Gene Expression protein RNA DNA
Gene Expression AAAAAAA AAAAAAA AAAAAAA AAAAAAA AAAAAAA AAAAAAA AAAAAAA AAAAAAA AAAAAAA mRNA gene1 AAAAAAA AAAAAAA AAAAAAA AAAAAAA AAAAAAA mRNA gene2 AAAAAAA AAAAAAA AAAAAAA AAAAAAA mRNA gene3
Studying Gene Expression 1987-2011 Spotted microarray One channel microarray RNA-seq (Next Generation Sequencing)
Classical versus modern technologies to study gene expression • Classical Methods (Spotted microarray, DNA chips) • -Require prior knowledge on the RNA transcript • Good for studying the expression of known genes • New generation RNA sequencing • Do not require prior knowledge • Good for discovering new transcripts
Classical Methods • Spotted Microarray Two channel cDNA microarrays. • DNA Chips One channel microarrays (Affymetrix, Agilent),
Experimental Protocol Two channel cDNA arrays • Design an experiment (probe design) 2. Extract RNA molecules from cell • Label molecules with fluorescent dye • Pour solution onto microarray • Then wash off excess molecules 5. Shine laser light onto array • Scan for presence of fluorescent dye 6. Analyze the microarray image
Conditions Genes / mRNAs Expression Data Format coldnormal hot uch1 -2.0 0.0 0.924 gut2 0.398 0.402 -1.329 fip1 0.225 0.225 -2.151 msh1 0.676 0.685 -0.564 vma2 0.41 0.414 -1.285 meu26 0.353 0.286 -1.503 git8 0.47 0.47 -1.088 sec7b 0.39 0.395 -1.358 apn1 0.681 0.636 -0.555 wos2 0.902 0.904 -0.149
The ratio of expression is indicated by the intensity of the color Red= HighmRNA abundance in the experiment sample Green= High mRNA abundance in the control sample Cy5 Cy3 Cy5 log2 Cy3 Transforming raw data to ratio of expression Cy3 Cy5
One channel DNA chips • Each sequence is represented by a probe set colored with one fluorescent dye • Target hybridizes to complimentary probes only • The fluorescence intensity is indicative of the expression of the target sequence
Applications • Identify gene function • Similar expression can infer similar function • Find tissue/developmental specific genes • Different expression in different cells/tissues • Diagnostics and Therapy • Different genes expression can indicate a disease state • Genes which change expression in a disease can be good candidates for drug targets
Gene Expression Analysis • Unsupervised -Hierarchical Clustering -Partition Methods K-means • Supervised Methods -Analysis of variance -Discriminant analysis -Support Vector Machine (SVM)
Clustering genes according to their expression profiles Experiments . Genes
Clustering Clustering organizes things that are close into groups. - What does it mean for two genes to be close? - Once we know this, how do we define groups?
What does it mean for two genes to be close? We need a mathematical definition of distance between the expression of two genes Gene 1 Gene 2 Gene1= (E11, E12, …, E1N)’ Gene2= (E21, E22, …, E2N)’ • For example distance between gene 1 and 2 • Euclidean distance= Sqrt of Sum of (E1i -E2i)2, i=1,…,N
Once we know this, how do we define groups? • Michael Eisen, 1998 : • Generate a tree based on similarity • (similar to a phylogenetic tree) • Each gene is a leaf on the tree • Distances reflect similarity of expression Hierarchical Clustering Gene Cluster Genes Experiments
Internal nodes • represent different • functional • Groups (A, B, C, D, E) genes • One genes may belong • to more than one cluster
What can we learn from clusters with similar gene expression ?? • Similar expression between genes • The genes have similar function • One gene controls the other in a pathway • All genes are controlled by a common regulatory genes • Clusters can help identify regulatory motifs • Search for motifs in upstream promoter regions of all the genes in a cluster
EXAMPLE- hnRNP A1 and SRp40 Gene with similar expression pattern tend to have common functions HnRNPA1 and SRp40 have a similar gene expression pattern in different tissues
EXAMPLE- hnRNP A1 and SRp40 Gene with similar expression pattern tend to have common functions hnRNP A1 SRp40
Are they regulated by the same transcription factor ? 1. Extract their promoter regions 2. Find a common motif in both sequences (MEME) hnrnpA1 SRp40 gene Promoter Common motif 3. Identify the transcription factor related to the motif http://jaspar.cgb.ki.se/
Extract the promoters of the genes in the cluster and find a common motif (using MEME) >GGATAACAATTTCACAAGTGTGTGAGCGGATAACAA >AAGGTGTGAGTTAGCTCACTCCCCTGTGATCTCTGTACATAG >ACGTGCGAGGATGAGAACACAATGTGTGTGCTCGGTTTAGTCACC >TGTGACACAGTGCAAACGCGCCTGACGGAGTTCACA >AATTGTGAGTGTCTATAATCACGATCGATTTGGAATATCCATCACA >TGCAAAGGACGTCACGATTTGGGAGCTGGCGACCTGGGTCATG >TGTGATGTGTATCGAACCGTGTATTTATTTGAACCACATCGCAGGTGAGAGCCATCACAG >GAGTGTGTAAGCTGTGCCACGTTTATTCCATGTCACGAGTGT >TGTTATACACATCACTAGTGAAACGTGCTCCCACTCGCATGTGATTCGATTCACA
Create a Multiple Sequence Alignment GGATAACAATTTCACA TGTGAGCGGATAACAA TGTGAGTTAGCTCACT TGTGATCTCTGTTACA CGAGGATGAGAACACA CTCGGTTTAGTTCACC TGTGACACAGTGCAAA CCTGACGGAGTTCACA AGTGTCTATAATCACG TGGAATATCCATCACA TGCAAAGGACGTCACG GGCGACCTGGGTCATG TGTGATGTGTATCGAA TTTGAACCACATCGCA GGTGAGAGCCATCACA TGTAAGCTGTGCCACG TTTATTCCATGTCACG TGTTATACACATCACT CGTGCTCCCACTCGCA TGTGATTCGATTCACA
Generate a PSSM Find the transcription factor which bind the motif
cDNA Microarrays Parallel Gene Expression Analysis Gene-Expression Profiles in Hereditary Breast Cancer • Breast tumors studied: • BRCA1 • BRCA2 • sporadic tumors • Log-ratios measurements of 3226 genes for each tumor after initial data filtering RESEARCH QUESTION Can we distinguish BRCA1 from BRCA2– cancers based solely on their gene expression profiles?
How can microarrays be used as a basis for diagnostic ? 5 Breast Cancer Patient
How can microarrays be used as a basis for diagnostic ? BRCA1 BRCA2 Informative Genes
Specific Examples Cancer Research Hundreds of genes that differentiate between cancer tissues in different stages of the tumor were found. The arrow shows an example of a tumor cells which were not detected correctly by histological or other clinical parameters. Ramaswamy et al, 2003 Nat Genet 33:49-54
Supervised approachesfor predicting gene function based on microarray data • SVM would begin with a set of genes that have a common function (red dots), In addition, a separate set of genes that are known not to be members of the functional class (blue dots) are specified.
? • Using this training set, an SVM would learn to differentiate between the members and non-members of a given functional class based on expression data. • Having learned the expression features of the class, the SVM could recognize new genes as members or as non-members of the class based on their expression data.
Using SVMs to diagnose tumors based on expression data Each dot represents a vector of the expression pattern taken from a microarray experiment . For example the expression pattern of all genes from a cancer patients.
? How do SVM’s work with expression data? In this example red dots can be primary tumors and blue are from metastasis stage. The SVM is trained on data which was classified based on histology. After training the SVM we can use it to diagnose the unknown tumor.
Gene Expression Databasesand Resources on the Web • GEO Gene Expression Omnibus -http://www.ncbi.nlm.nih.gov/geo/ • List of gene expression web resources • http://industry.ebi.ac.uk/~alan/MicroArray/ • Another list with literature references • http://www.gene-chips.com/ • Cancer Gene Anatomy Project • http://cgap.nci.nih.gov/ • Stanford Microarray Database • http://genome-www.stanford.edu/microarray/