Download
1 / 34
360 likes | 528 Views
WORD-PREDICTION AS A TOOL TO EVALUATE LOW-LEVEL VISION PROCESSES. Prasad Gabbur, Kobus Barnard University of Arizona. Overview. Word-prediction using translation model for object recognition Feature evaluation Segmentation evaluation Modifications to Normalized Cuts segmentation algorithm

E N D
WORD-PREDICTION AS A TOOL TO EVALUATE LOW-LEVEL VISION PROCESSES Prasad Gabbur, Kobus Barnard University of Arizona
Overview • Word-prediction using translation model for object recognition • Feature evaluation • Segmentation evaluation • Modifications to Normalized Cuts segmentation algorithm • Evaluation of color constancy algorithms • Effects of illumination color change on object recognition • Strategies to deal with illumination color change
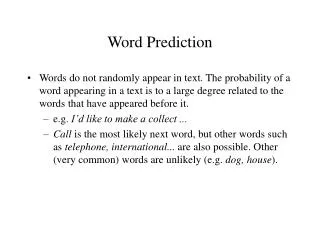
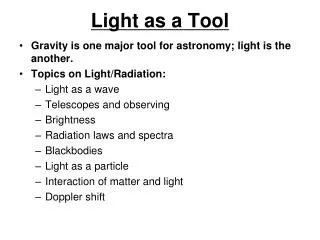
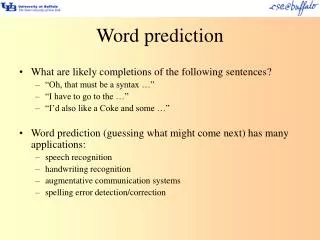
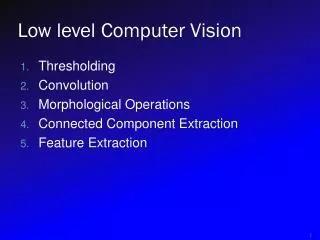
Motivation • Low-level computer vision algorithms • Segmentation, edge detection, feature extraction, etc. • Building blocks of computer vision systems • Is there a generic task to evaluate these algorithms quantitatively? • Word-prediction using translation model for object recognition • Sufficiently general • Quantitative evaluation is possible
Translation model for object recognition Translate from visual to semantic description
Approach Corel database Model joint probability distribution of visual representations and associated words using a large, annotated image collection.
Image pre-processing Segmentation* visual features [f1 f2 f3 …. fN] sun sky waves sea Joint distribution * Thanks to N-cuts team [Shi, Tal, Malik] for their segmentation algorithm
joint visual/textual concepts * Nodel blob Frequency table Gaussian over features word Learn P(w|l), P(b|l), and P(l) from data using EM *Barnard et al JMLR 2003
Annotating images b1 P(w|b1) + Segment image Compute P(w|b) for each region Sum over regions b2 P(w|b2) . . . P(w|image)
Actual Keywords Measuring performance • Large region-labeled databases are not available • Large annotated databases are available CAT TIGER GRASS FOREST Predicted Words CAT HORSEGRASSWATER • Record percent correct • Use annotation performance as a proxy for recognition
Experimental protocol Corel database Each CD contains 100 images on one specific topic like “aircraft” Average results over 10 different samplings sampling scheme 160 CD’s 80 CD’s 80 CD’s Novel 75% Training 25% Test
Semantic evaluation of vision processes • Feature sets Combinations of visual features • Segmentation methods • Mean-Shift [Comaniciu, Meer] • Normalized Cuts [Shi, Tal, Malik] • Color constancy algorithms • Train with illumination change • Color constancy processing – Gray-world, Scale-by-max
Feature evaluation Features Size Context (Average surrounding color) Location • Color • (RGB, L*a*b, rgS) • Average color • Standard deviation • Texture • Responses to a bank of filters • Even and Odd symmetric • Rotationally symmetric (DOG) • Shape • Second moment • Compactness • Convexity • Outer boundary descriptor
Feature evaluation Annotation Performance (bigger is better) Base = Size + Location + Second moment + Compactness
Segmentation evaluation Mean Shift (Comaniciu, Meer) Normalized Cuts (N-Cuts) (Shi, Tal, Malik)
Segmentation evaluation Annotation Performance (bigger is better) # regions • Performance depends on number of regions used for annotation • Mean Shift is better than N-Cuts for # regions < 6
Normalized Cuts • Graph partitioning technique • Bi-partitions an edge-weighted graph in an optimal sense • Normalized cut (Ncut) is the optimizing criterion Nodes i j wij A B Edge weight => Similarity between i and j Minimize Ncut(A,B) • Image segmentation • Each pixel is a node • Edge weight is similarity between pixels • Similarity based on color, texture and contour cues
Normalized Cuts Original algorithm Preseg Seg Final Initial seg seg pixel region region pixel • Produces splits in homogeneous regions, e.g., “sky” • Local connectivity between pixels
Modifications to Normalized Cuts Meta-segmentation Preseg Iteration 1 Iteration n region region region region l l k k Original Modified
Modifications to Normalized Cuts Original Modified Original Modified
Original vs. Modified Annotation Performance (bigger is better) # regions • For # regions < 6, modified out-performs original • For # regions > 6, original is better
Incorporating high-level information into segmentation algorithms Low-level segmenters split up objects (eg. Black and white halves of a penguin) Using word-prediction gives a way to incorporate high-level semantic information into segmentation algorithms Propose a merge between regions that have similar posterior distributions over words
Illumination change Makes recognition difficult Illumination color change * Illuminant 1 Illuminant 2 • Strategies to deal with illumination change: • Train for illumination change • Color constancy pre-processing and normalization * http://www.cs.sfu.ca/~colour/data
Train for illumination change Training Variation of color under expected illumination changes [Matas et al 1994, Matas 1996, Matas et al 2000]
Color constancy pre-processing Unknown illuminant Canonical (reference) illuminant Recognition system Test Input Algorithm (Map image as if it were taken under reference illuminant). Canonical (reference) illuminant Training database [Funt et al 1998]
Color normalization Unknown illuminant Canonical (reference) illuminant Recognition system Test Input Algorithm (Map image as if it were taken under reference illuminant). Unknown illuminant Canonical (reference) illuminant Training database Normalized training database Algorithm [Funt and Finlayson 1995, Finlayson et al 1998]
Simulating illumination change 0 1 2 3 5 4 8 6 7 10 11 illuminants (0 is canonical) 9
Train with illumination variation Annotation Performance (bigger is better) Experiment A Training:No illumination change Testing:No illumination change Experiment B Training:No illumination change Testing:Illumination change Experiment C Training:Illumination change Testing:Illumination change
Color constancy pre-processing Gray-world Training Test Canonical Unknown Algorithm Canonical Mean color = constant
Color constancy pre-processing Scale-by-max Training Test Canonical Unknown Algorithm Canonical Max color = constant
Color constancy pre-processing Annotation Performance (bigger is better) Experiment A Training:No illumination change Testing:No illumination change Experiment B Training:No illumination change Testing:Illumination change Others Training:No illumination change Testing:Illumination change + Color constancy algorithm
Color normalization Gray-world Scale-by-max Training Test Training Test Unknown Unknown Algorithm Algorithm Canonical Canonical Mean color = constant Max color = constant
Color normalization Annotation Performance (bigger is better) Experiment A Training:No illumination change Testing:No illumination change Experiment B Training:No illumination change Testing:Illumination change Others Training:No illumination change + Color constancy algorithm Testing:Illumination change + Color constancy algorithm
Conclusions • Translation (visual to semantic) model for object recognition • Identify and evaluate low-level vision processes for recognition • Feature evaluation • Color and texture are the most important in that order • Shape needs better segmentation methods • Segmentation evaluation • Performance depends on # regions for annotation • Mean Shift and modified NCuts do better than original NCuts for # regions < 6 • Color constancy evaluation • Training with illumination helps • Color constancy processing helps (scale-by-max better than gray-world)