Download
1 / 40
400 likes | 412 Views
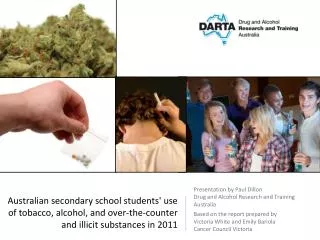
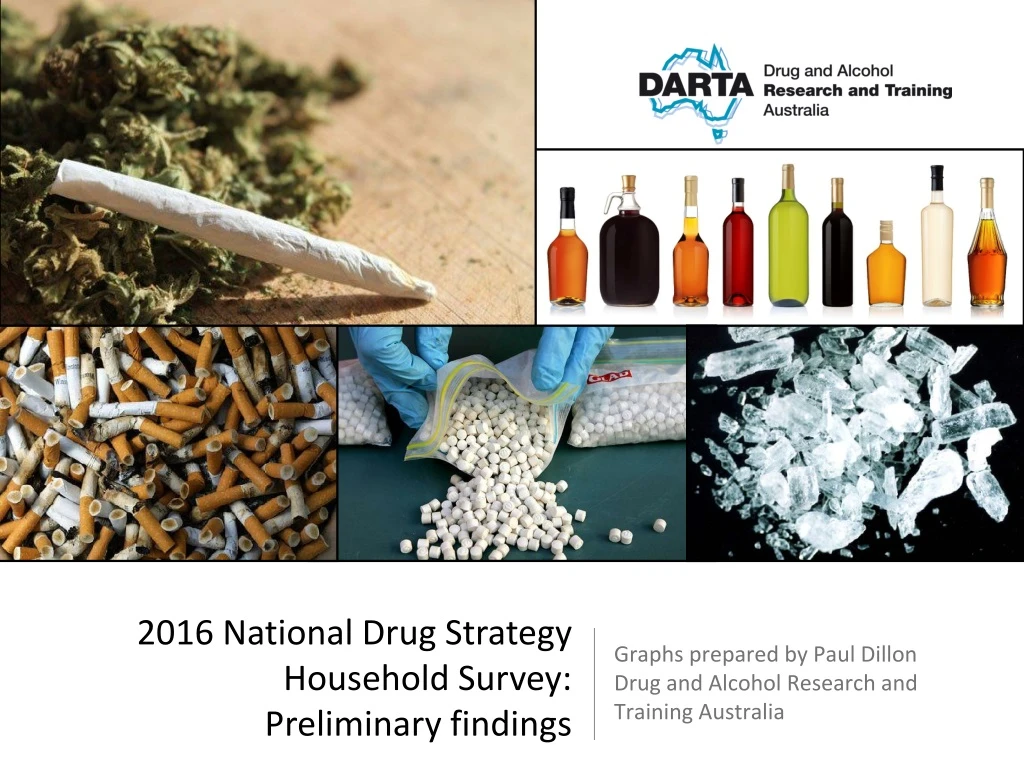
Graphs prepared by Paul Dillon Drug and Alcohol Research and Training Australia. 2016 National Drug Strategy Household Survey: Preliminary findings. Lifetime illicit drug use (%) - 14 years and over AIHW (2017) 2016 National Drug Household Survey. %.

E N D
Graphs prepared by Paul Dillon Drug and Alcohol Research and Training Australia 2016 National Drug Strategy Household Survey: Preliminary findings
Lifetime illicit drug use (%) - 14 years and overAIHW (2017) 2016 National Drug Household Survey % Cannabis continues to be the most popular illicit drug in Australia with around one-third (34.8%) of the population reporting ever having used the substance. Around one in ten Australians report using either ecstasy (11.2%), hallucinogens (9.4%) or cocaine (9%), with cocaine use increasing significantly since the last survey in 2013. Although reported use of meth/amphetamine use dropped once again (7% to 6.3%), 'ice' (the most potent form of the drug) continues to be the main form that is used
Never used illicit drugs (%) - 14 years and overAIHW (2017) 2016 National Drug Household Survey %
Recent illicit drugs (%) - 14 years and overAIHW (2017) 2016 National Drug Household Survey % 'Recent use' (or use in the last 12 months) of illicit drugs continues to be low and stable according to the 2016 NDSHS. Declines were seen in recent use of some substances in 2016 including meth/amphetamines (from 2.1% to 1.4%), hallucinogens (1.3% to 1.0%), and synthetic cannabinoids (1.2% to 0.3%). There were small increases in cannabis (from 10.2% to 10.4% and cocaine (2.1% to 2.5%)
Recent not used illicit drugs (%) - 14 years and overAIHW (2017) 2016 National Drug Household Survey %
Changes in 'recent use' (%): 1991-2016AIHW (2017) 2016 National Drug Household Survey % Recent use (use in the past year) remained fairly steady across most illicits, with amphetamines and ecstasy showing decreases since 2013. Despite media reports that meth/amphetamine use has increased dramatically, use within the general population continues to decline and is nowhere near the peak in the late 90s. It is important to note that 'ice' (the more potent form of amphetamine) use had doubled amongst amphetamine users but not across the general community
Lifetime illicit drug use (%) - 14 years and overComparison 2013-2016 AIHW (2017) 2016 National Drug Household Survey % Lifetime illicit drug use remained relatively stable according to the 2016 NDSHS, with little change from the results of the 2013 survey. Reported use of meth/amphetamine decreased (7% down to 6.3%) and was significant, as was the increased use of cocaine (8.1% rising to 9% in 2016). Lifetime ecstasy use rose but those reporting use in the previous 12 months declined
Recent use of illicit drugs, people aged 14 years or older, by age, 1995-2016AIHW (2017) 2016 National Drug Household Survey % The 2016 NDSHS show that for those aged under 40, recent illicit drug use was fairly stable with little change from the last survey in 2013. However, for people in their 40s, 50s and 60s, illicit drug use in the previous year, particularly the use of cannabis and cocaine, had increased between 2013 and 2016
Drug thought to be of most concern for the general community, people aged 14 years or over, 2007-2016AIHW (2017) 2016 National Drug Household Survey % People's perceptions of meth/amphetamines changed considerably between 2013 and 2016. Meth/amphetamines is now thought to be more of concern than any other drug (including alcohol) and almost one in five (19.2%) believe that it causes the most drug-related deaths in Australia. Perception of all other illicits remained fairly stable
Drug thought to be of most concern for the general community, people aged 14 years or over, 2007-2016AIHW (2017) 2016 National Drug Household Survey % People's perceptions of meth/amphetamines changed considerably between 2013 and 2016. Meth/amphetamines is now thought to be more of concern than any other drug (including alcohol) and almost one in five (19.2%) believe that it causes the most drug-related deaths in Australia. Perception of all other illicits remained fairly stable
Drug thought to be of most concern for the general community, people aged 14 years or over, 2007-2016AIHW (2017) 2016 National Drug Household Survey %
Tobacco 2016 NDSHS
Tobacco smoking status, people aged 14 years or older, 1991-2016 AIHW (2017) 2016 National Drug Household Survey % 12.2% of people aged 14 or over were daily smokers in 2016. While smoking rates have been on a long-term downward trend, for the first time in over two decades, the daily smoking rate did not significantly decline over the most recent 3-year period (2013 to 2016). Weekly and less than weekly rates remained stable
Tobacco smoking status, people aged 14 years or older, 1991-2016 AIHW (2017) 2016 National Drug Household Survey % The number of Australians who have 'never smoked' (defined as not smoking more than 100 cigarettes) continues to increase, rising from 49% in 1991 to 62.3% in 2016. The number of ex-smokers peaked in 2004 at 26.4% and decreased significantly from 2013 to 22.8%
Alcohol 2016 NDSHS
Alcohol drinking status: proportion of the population aged 14 years or older, 1991-2016AIHW (2017) 2016 National Drug Household Survey %
Alcohol - non-drinking status: proportion of the population aged 14 years or older, 1991-2016AIHW (2017) 2016 National Drug Household Survey % The number of Australians abstaining from alcohol use hit a new peak with 22.9% reporting not drinking. Those who reported never drinking a full glass of alcohol has more than doubled since 1991 (from 6.5% to 14.5% in 2016). Eight per cent of respondents were ex-drinkers (they that had consumed a full glass of alcohol but not in the last 12 months) with the number remaining relatively stable since 2001
Cannabis 2016 NDSHS
How have things changed? Lifetime and recent cannabis use, 1993-2016 AIHW (2017) 2016 National Drug Household Survey % Lifetime (34.8%) and recent use (10.4%) of cannabis remained fairly stable since the last NDSHS in 2013. Usage rates peaked in 1998 and then declined to their lowest levels in 2007. Since that time cannabis use appears to have increased slightly, particularly amongst particular populations, e.g., males in their 40s
Recent use of cannabis: people aged 14 years or older, by age, 2016 AIHW (2017) 2016 National Drug Household Survey %
Recent use of cannabis: people aged 14 years or older, by age, 2013-2016 AIHW (2017) 2016 National Drug Household Survey %
Recent use of cannabis: people aged 14 years or older, by age and gender, 2016 AIHW (2017) 2016 National Drug Household Survey %
Ecstasy 2016 NDSHS
How have things changed? Lifetime and recent ecstasy use (%), 1991-2016AIHW (2017) 2016 National Drug Household Survey % The number of Australians reporting ever having used ecstasy continues to rise (11.2% compared to 10.9% in 2013), however, those who had used the drug in the last 12 months decreased once again (2.5% to 2.2%). Recent use of ecstasy peaked in 2007 (3.5%) and has dropped in every subsequent survey. We are now at similar rates to those of the late 1990s
Recent use of ecstasy: people aged 14 years or older, by age, 2016 AIHW (2017) 2016 National Drug Household Survey %
Recent use of ecstasy: people aged 14 years or older, by age, 2013-2016 AIHW (2017) 2016 National Drug Household Survey %
Recent use of ecstasy: people aged 14 years or older, by age and gender, 2016 AIHW (2017) 2016 National Drug Household Survey %
Meth/amphetamine 2016 NDSHS
How have things changed? Lifetime and recent meth/amphetamine use, 1993-2016 AIHW (2017) 2016 National Drug Household Survey % The number of Australians reporting ever having used meth/amphetamine has declined since the early 2000s (9.1% in 2004 compared to 6.3% in 2016). Recent use of meth/amphetamine also continues to decrease (peaking in 1998 at 3.7% and now down to 1.4%). 'Ice' (the crystalline form of the drug) was the main form of methamphetamines used in 2016 (was 57% in 2016; up from 22% in 2010 and 50% in 2013) and continues to cause great problems in parts of the country
Recent use of meth/amphetamine: people aged 14 years or older, by age, 2016 AIHW (2017) 2016 National Drug Household Survey %
Recent use of meth/amphetamine: people aged 14 years or older, by age, 2013-2016 AIHW (2017) 2016 National Drug Household Survey %
Cocaine 2016 NDSHS
How have things changed? Lifetime and recent cocaine use, 1993-2016 AIHW (2017) 2016 National Drug Household Survey % The number of Australians reporting ever having used cocaine continues to rise (8.1% compared to 9% in 2013). Similarly, those who had used the drug in the last 12 months increased once again (2.1% to 2.5%). Unlike other illicit drugs, where prevalence rates have remained relatively stable or have decreased over time, the reported use of cocaine continues to rise, more than trebling since 1993 (2.5% to 9%)
Recent use of cocaine: people aged 14 years or older, by age, 2016 AIHW (2017) 2016 National Drug Household Survey %
Recent use of cocaine: people aged 14 years or older, by age, 2013-2016 AIHW (2017) 2016 National Drug Household Survey %
Hallucinogens The term 'hallucinogens' includes synthetic and naturally occurring hallucinogens (acid, trips, mushies, magic mushrooms, blotter, angels trumpet and blue meanies) 2016 NDSHS
How have things changed? Lifetime and recent hallucinogen use, 1993-2016 AIHW (2017) 2016 National Drug Household Survey % The number of Australians reporting ever having used hallucinogens remained stable (9.4% in both 2013 and 2016). Those who had used the drug in the last 12 months, however, decreased (1.3% to 1%). Lifetime use of hallucinogens continues to be at higher rates than in the early 2000s
Pharmaceuticals and over-the-counter medications Non-medical purposes - "in ways that induced or enhanced a drug experience" (AIHW, 2011) 2016 NDSHS
Recent use of pharmaceuticals for non-medical purposes, people aged 14 years or older, by age and gender, 2016 AIHW (2017) 2016 National Drug Household Survey %
Types of pain-killers and opioids misused in the previous 12 months by recent users, by age, 2016 AIHW (2017) 2016 National Drug Household Survey %