Download
1 / 27
270 likes | 448 Views
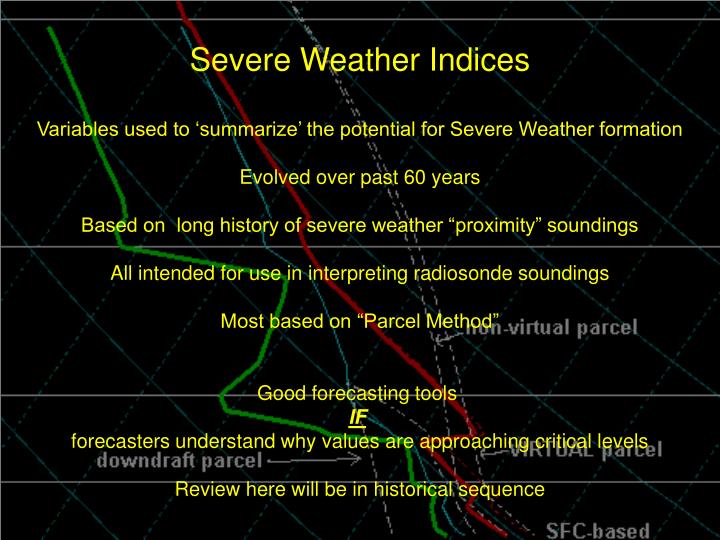
. Severe Weather Indices Variables used to ‘summarize’ the potential for Severe Weather formation Evolved over past 60 years Based on long history of severe weather “proximity” soundings All intended for use in interpreting radiosonde soundings Most based on “Parcel Method”

E N D
. Severe Weather Indices Variables used to ‘summarize’ the potential for Severe Weather formation Evolved over past 60 years Based on long history of severe weather “proximity” soundings All intended for use in interpreting radiosonde soundings Most based on “Parcel Method” Good forecasting tools IF forecasters understand why values are approaching critical levels Review here will be in historical sequence
Showalter Index Thermodynamic only Developed to forecast tornadoes in Oklahoma using “mandatory level” radiosonde data only Before the era of automated radiosonde observations in the US, data were transmitted in several parts: First – Mandatory level data from surface to 100 hPa Second – Other “significant” levels form surface to 100 hPa Third – Mandatory level data from surface to 100 hPa Last – Other “significant” levels form surface to 100 hPa First transmission of mandatory level data was ALWAYS required and made 30-60 minutes earlier that other transmission Important to use earliest data
Showalter Index Thermodynamic only Developed to forecast tornadoes in Oklahoma using “mandatory level” radiosonde data only SI = Difference of Temperature of parcel lifted from 850 hPa and the 500 hPa temp. SI = T500- TPcl500 Measures the buoyancy of a parcel lifted from the lower to the mid-troposphere Does not account for buoyancy (vertical accelerations) above or below 500 hPa Does account for 850 hPa moisture implicitly when lifted parcel reaches saturation, but not above or below 850 hPa – does not include mid-level dryness Intended for stations near sea level, but also found to be good for elevated convection Critical values: · 0 or greater= stable · -1 to -4= marginal instability · -5 to -7= large instability · -8 to -10= extreme instability · -11 or less = ridiculous instability
Showalter Index Thermodynamic only Developed to forecast tornadoes in Oklahoma using “mandatory level” radiosonde data only 300 hPa 500 hPa 700 hPa 850 hPa 1000 hPa
Total Totals Index Simplified - Thermodynamic only Developed to forecast tornadoes in Oklahoma using “mandatory level” radiosonde data only Totals Totals = Vertical Totals + Cross Totals Indices Vertical Totals = (T850 - T500) Cross Totals = (Td850 – T500) TT = (T850 - T500) + (Td850 - T500) Combines lower tropospheric lapse rate (doubled?) + amount of moisture at low levels Does not account for low level moisture above or below 850 hPa Intended for stations near sea level Critical values: <44 Convection not likely 44-50 Likely thunderstorms 51-52 Isolated severe storms 53-56 Widely scattered severe >56 Scattered severe storms
Total Totals Index Simplified - Thermodynamic only Developed to forecast tornadoes in Oklahoma using “mandatory level” radiosonde data only 300 hPa 500 hPa 700 hPa 850 hPa 1000 hPa Vertical Totals Cross Totals
K Index Modification of Total Totals Index for tropical convection Simplified - Thermodynamic only Developed to forecast convection in sourtheastern US using “mandatory level” radiosonde data only K Index = Vertical Totals + lower tropospheric moisture characteristics Vertical Totals = (T850 - T500) Moisture = (Td850 – Tdd700), where Td850 is 850 hPa dewpoint value and Tdd700 is 700 hPa dewpoint depression K = (T850 - T500) + (Td850 – Tdd700) Combines lower tropospheric lapse rate + amount of moisture in 850-700 hPa layer, but does not account for presence of mid-level dryness Does not account for low level moisture aside from 850 and 700 hPa Intended for stations near sea level Critical values: 15-25 Small convective potential 26-39 Moderate convective potential 40+ High convective potential
Total Totals Index Simplified - Thermodynamic only Developed to forecast tornadoes in Oklahoma using “mandatory level” radiosonde data only 300 hPa 500 hPa 700 hPa 850 hPa 1000 hPa Vertical Totals
SWEAT (Severe Weather Threat) Index Expansion of Total Totals Index Thermodynamic and wind based Developed to forecast tornadoes and thunderstorms using “mandatory level” radiosonde data SWEAT= 12(Td850) + 20(TT - 49) + 2(V850) + (V500) + 125(sin(-(dd500 - dd850)) + 0.2)Td850 = 850 mb dewpoint Modified for Southern Hemisphere TT = Total Totals IndexV850 = 850 mb wind speedV500 = 500 mb wind speed , - ( dd500 - dd850 ) = Directional backing of wind with height (warm advection) Many ‘emperial’ factors, but includes importance of wind structure and warm advection Does not account for low level moisture above or below 850 hPa, parcel buoyancy or mid-level dryness Intended for stations near sea level Critical values: 150-300 Slight severe 300-400 Severe possible 400+ Tornadic possible -If TT less than 49, then that term of the equation is set to zero -If any term is negative then that term is set to zero-Winds must be backing with height or that term is set to zero
Lifted Index Expansion of the Showalter Index Thermodynamic only Developed to forecast tornadoes across the US using “mandatory level” and “significant level” radiosonde data LI = Difference of Temperature of parcel lifted from lowest 50-100 hPa of the atmosphere and the 500 hPa temp. LI = T500 – TPcl500 Measures the buoyancy of a parcel lifted from the lower to the mid-troposphere Does not account for buoyancy (vertical accelerations) above or below 500 hPa Accounts for low level moisture implicitly when lifted parcel reaches saturation Intended for stations near sea level Critical values: · 0 or greater= stable · -1 to -4= marginal instability · -5 to -7= large instability · -8 to -10= extreme instability · -11 or less = ridiculous instability
Lifted Index Expansion of the Showalter Index Thermodynamic only Developed to forecast tornadoes across the US using “mandatory level” and “significant level” radiosonde data 300 hPa 500 hPa 700 hPa 850 hPa 1000 hPa
Variations on the theme of the Lifted Index Further expansion of the Showalter Index Thermodynamic only Developed to forecast tornadoes in Oklahoma using “mandatory level” and “significant level” radiosonde data LI = Difference of Temperature (buoyancy) of parcel lifted from lowest 50-100 hPa of the atmosphere and the 500 hPa temp. LI = T500 – TPcl500 Surface based LI – Uses parcels starting from the surface (can be used to combine Hourly METAR data with model 500 forecasts) Least Stable LI – Takes parcels from all reporting levels in the lowest 150 hPa and determines the least stable calculation – Good for elevated and nocturnal convection Forecast (Virtual) LI - Uses parcels starting from the surface using forecast max temperature Critical values: · 0 or greater= stable · -1 to -4= marginal instability · -5 to -7= large instability · -8 to -10= extreme instability · -11 or less = ridiculous instability
Convective Available Potential Energy (CAPE) Expansion of the variations of the Lifted Index Thermodynamic only Developed to forecast tornadoes and severe thunderstorms using “mandatory level” and “significant level” radiosonde data CAPE = the positive area on a sounding (the area between the parcel and environmental temperature throughout the entire sounding) Includes no wind information nor information about the strength of the “LID” inhibiting convection Can be used to forecast storm intensity, including heavy precip, hail, wind gusts Use in conjunction with Convective Inhibition (CIN) and Precipitable Water (PW) Max vertical motion ≈ (2 x CAPE)1/2, without including water loading, entrainment Intended for all stations. Critical values: · 1 to 1,500 Positive CAPE · 1,500 to 2,500 Large CAPE · 2,500 + Extreme CAPE
Convective Available Potential Energy (CAPE) Expansion of the variations of the Lifted Index Thermodynamic only Developed to forecast tornadoes and severe thunderstorms using “mandatory level” and “significant level” radiosonde data High CAPE means storms will build vertically very quickly. The updraft speed depends on the CAPE environment.Hail: As CAPE increases (especially above 2,500 J/kg) the hail potential increases. Large hail requires very large CAPE values.Downdraft: An intense updraft often produces an intense downdraft since an intense updraft will condense out a large amount of moisture. Expect isolated regions of very heavy rain when storms form in a large or extreme CAPE environment.Lightning: Large and extreme CAPE will produce storms with abundant lightning. C A P E C A P E LI
Variations of Convective Available Potential Energy (CAPE) Expansion of the variations of the Lifted Index Thermodynamic only Developed to forecast tornadoes and severe thunderstorms using “mandatory level” and “significant level” radiosonde data CAPE = the positive area on a sounding (the area between the parcel and environmental temperature throughout the entire sounding) Boundary Layer CAPE – Uses parcels starting from 50-100 hPa deep boundary layer Surface based CAPE – Uses parcels starting from the surface (can be used to combine Hourly METAR data with model 500 forecasts) - strong diurnal variability – PM storms Least Stable CAPE – Takes parcels from all many levels in the lowest 150-200 hPa and determines the least stable calculation – Good for elevated and nocturnal convection Forecast (Virtual) CAPE - Uses parcels starting from the surface using forecast maximum temperature Critical values: · 1 to 1,500 Positive CAPE · 1,500 to 2,500 Large CAPE · 2,500 + Extreme CAPE C A P E LFC
Convective Inhibition (CINH) Expansion of the variations of the Lifted Index Thermodynamic only Developed to forecast non-occurrence of tornadoes and severe thunderstorms using “mandatory level” and “significant level” radiosonde data CINH is the area of the sounding between parcel’s starting level and to the level at which CAPE begins to be positive. In this region, the parcel will be cooler than the surrounding environment - thus this is a stable layer. CINH will be reduced by: 1) daytime heating, 2) synoptic upward forcing, 3) low level convergence, 4) low level warm air advection (especially if accompanied by higher dewpoints). CINH is most likely to be small in the late afternoon since daytime heating plays a crucial role in reducing CINH.Critical values: 0 – 50 Weak Cap 51 – 199 Moderate Cap 200+ Strong Cap C A P E LFC CINH
Additional Parameters related to Convective Available Potential Energy Expansion of the variations of the Lifted Index Thermodynamic only Developed to forecast tornadoes and severe thunderstorms using “mandatory level” and “significant level” radiosonde data CTP . Equilibrium Pressure (EP) = Pressure at top of positive CAPE area at which the air parcel temperature again equals environmental temperature. Cloud Top Pressure (CTP) = Pressure at which the negative area above EL equals the positive CAPE area.. Precipitable Water (PW) – Total amount of rain that would fall from a cloud if all moisture removed from atmosphere Critical values: EP and CTP - Larger values give deeper Clouds and more opportunity for growth PW – Water loading reduces CAPE impact PW < 2.5 cm = small, > 5 = larger effects EP C A P E
Equivalent Potential Temperature (E) Thermodynamic only Developed to assist forecasting of tornadoes and severe thunderstorms using any “mandatory level” and “significant level” radiosonde data Equivalent Potential Temperature (E) is a measure of the total thermal energy of a parcel of air, including both its sensible temperature and any latent heating potential present from its moisture content. Calculated by lifting a parcel of air dry/moist adiabatically from any level up to 100 hPa and then returning it dry adiabatically back down to 1000 hPa. Can be applied to parcels from any level, including surface, boundary layer, predicted maximum temperature, etc. Critical values: Higher values show greater potential for latent heating and therefore buoyancy E
Now for an index using LAYER Method - But first, a quick tutorial on STABLE Vertical Temperature Structure shows warmer air over air • 3 2 1 0 • Elevation (km) -20 -10 0 10 20 30 Temperature (C)
Using Parcel Method Determining if the atmosphere is conducive to convective storms STABLE Vertical Temperature Structure shows warmer air over colder air • 3 2 1 0 • Elevation (km) If parcels are lifted from either the top or bottom of the inversion layer, they both become cooler than surroundings and sink -20 -10 0 10 20 30 Temperature (C)
Using Layer Theory Determining if the atmosphere is conducive to convective storms STABLE Vertical Temperature Structure shows warmer dry air over colder dry air • 3 2 1 0 • Elevation (km) If entire profile is lifted by low-level convergence, -20 -10 0 10 20 30 Temperature (C)
Using Layer Method Determining if the atmosphere is conducive to convective storms STABLE Vertical Temperature Structure shows warmer dry air over colder dry air • 3 2 1 0 • Elevation (km) If entire profile is lifted by low-level convergence, the stable layer cools and changes altitude, but stability remains essentially unchanged. -20 -10 0 10 20 30 Temperature (C)
Using Layer Theory Determining if the atmosphere is conducive to convective storms If sufficient moisture is added to bottom of an otherwise stable layer, it can become Convectively Unstable. • 3 2 1 0 • Elevation (km) Dry But, if entire profileis lifted with moist bottom and top dry, Moist -20 -10 0 10 20 30 Temperature (C)
Determining if the atmosphere is conducive to convective storms If a Convectively Unstable layer is lifted sufficiently, it can become Absolutely Unstable. This will cause the layer to overturn and the moist air will raise rapidly. Latent heat added • 3 2 1 0 • Elevation (km) Dry But, if entire profileis lifted with moist bottom and top dry, the inversion bottom cools less than top and it becomes absolutely unstable – producing auto-convection Moist -20 -10 0 10 20 30 Temperature (C) So, we really need to monitor not onlythe flow of low level moisture, but more importantly to detect areas where Low-level Moistening and Upper-level Dryingwill occur simultaneously
Convective Instability (CI) Based on Equivalent Potential Temperature Thermodynamic only Developed to assist forecasting of tornadoes and severe thunderstorms using any “mandatory level” and “significant level” radiosonde data Convective Instability = the vertical difference of Equivalent Potential Temperature E between any two levels in the atmosphere divided by the vertical separation of the levels. CI = ( Etop - Ebottom ) / ( Ztop – Zbottom ) Extremely powerful when calculated across “Capping Inversion” Values increase with either: 1 - Larger E differences or 2 - Thinner depth of capping inversion Develops in localized areas Development of Storm potential can be monitored by tracing forecasts of E movement at multiple levels Critical values: Higher values show greater potential for diabatic heating and therefore buoyancy Dry with low E Higher Moist with high E Lower
TOTAL TOTALS SPEED SHEAR SR HELICITY K INDEX SWEAT CAPE BRN Lifted index Summary of critical value of Traditional Severe Storm Indices Total Totals K index Sweat Index CAPE Good web reference: www.theweatherprediction.com/severe/indices
NOTES:-Max vertical motion = √ 2 × CAPE-Showalter (SWI) = used when elevated convection is most likely (cool season)-SWEAT = 12(850Td) +20(TT-49) +2(V850) + (V500) +125(sin(dd500-dd850) + 0.2)-Total Totals= (T850- T500) + (Td850 - T500)= vertical totals plus cross totals-K index = (T850 -T500) + (Td850 - Tdd700)-Important to look for thermal and dewpoint ridges (THETA-E)-For tornado, inflow must be greater than 20 knots-20 to 30% of mesocyclones produce tornadoes-Look for differential advection; warm/ moist at surface, dry in mid levels-Severe weather hodograph: veering, strong sfc to 850 directional shear- >100 J/kg negative buoyancy is significant-Strong cap when > 2 degrees Celsius-Study depth of moisture, TT unreasonable when low level moisture is lacking-KI used for heavy convective rain, values vary with location/season-Instability enhanced by ... daytime heating, outflow boundaries-Models generally have weak handle on return flow from Gulf, low level jet, convective rainfall, orography, mesoscale boundaries, and boundary conditions-Large hail when freezing level >675 mb, high CAPE, supercell storms -Synoptic scale uplift from either low-level warm advection or upper level divergence-T-storm warning when Hail > 3/4", wind > 58 mph, radar wind shear > 90 kts/3 km