Download
1 / 21

E N D
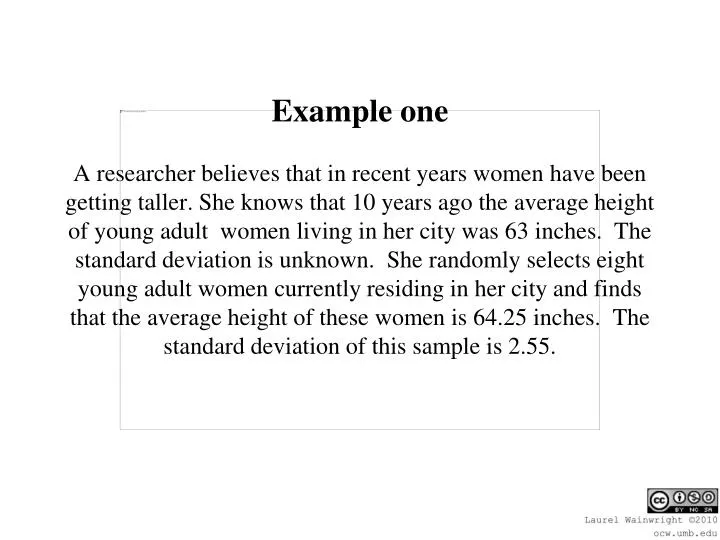
Example oneA researcher believes that in recent years women have been getting taller. She knows that 10 years ago the average height of young adult women living in her city was 63 inches. The standard deviation is unknown. She randomly selects eight young adult women currently residing in her city and finds that the average height of these women is 64.25 inches. The standard deviation of this sample is 2.55.
What are the critical pieces that will tell us which t-test to use?
Example oneA researcher believes that in recent years women have been getting taller. She knows that 10 years ago the average height of young adult women living in her city was 63 inches. The standard deviation is unknown. She randomly selects eight young adult women currently residing in her city and finds that the average height of these women is 64.25 inches. The standard deviation of this sample is 2.55. • µ=63 (population average) • n=8 (number in this sample) • =64.25 (average of this sample) • S=2.55 (standard deviation of this sample)
Which test to do? • We don’t know the population SD so we can’t find a z-score. • We have only one sample, so we need to use a t-test for single samples.
Statistical Hypothesis Statements • H0 : u = 63 (This sample is from the population whose mean is 63). • H1 : u 63(This sample is not from the population whose mean is 63).
t-test for single samples • df = n-1n = 8df = n-1 = 8-1 = 7 critical value=2.365 (from t-table)
t-test for single samples • Since computed t is less than critical t, (1.39 < 2.365),We accept H0(H0: u = 63)Women continue to be the same height as they were ten years ago.
Ex.2A psychologist is interested in determining whether memory is affected by sleep loss. 12 normal subjects are randomly selected and assigned to two groups of 6 each. Group one gets a normal amount of sleep (7-8 hours). This group’s mean score is 70.17 with a standard deviation of 3.18. Group two is sleep deprived for 24 hours. They have an average score of 65.33 and a standard deviation of 4.18.
A psychologist is interested in determining whether memory is affected by sleep loss. 12 normal subjects are randomly selected and assigned to two groups of 6 each. Group one gets a normal amount of sleep (7-8 hours). This group’s mean score is 70.17 with a standard deviation of 3.18. Group two is sleep deprived for 24 hours. They have an average score of 65.33 and a standard deviation of 4.18.S1=3.18 S2=4.18
Which test to do? • Can’t do a z-score because we don’t know the standard dev. of the population • Can’t do a t-test for single samples because we have two samples. • Because we have two samples, we have to do a t-test for 2 independent samples
Statistical hypothesis statements: • H0: u1 = u2 The two samples are from the same population. • H1: u1 ≠ u2The two samples are not from the same population.
t-test for independent samples • Can use shortened formula because the two samples are of equal size.
t-test for independent samples • t= 2.26 (computed t value) • For independent samples t-testdf= n1 + n2-2=6+6-2 =10critical t value: 2.228 (from t-table)
t-test for independent samples • Since computed t is greater than critical T, (2.26 > 2.228),We reject H0Accept H1: u1 u2 The two groups are significantly different from each other. There is an effect of sleep deprivation on memory.
Example 3 • To motivate citizens to conserve fuel, the government would like to mount a nationwide campaign. Before doing so however, they wish to test the effectiveness of the campaign. Twelve families are selected and their consumption of fuel before the campaign and afterward is monitored.
What kind of t-test should be done here? • To motivate citizens to conserve fuel, the government would like to mount a nationwide campaign. Before doing so however, they wish to test the effectiveness of the campaign. Twelve families are selected and their consumption of fuel before the campaign and afterward is monitored.
t-test for matched samples • Something in the problem talking about subjects matched or that the same subjects took a test twice (before and after) or same subjects taking test at time 1 and time 2
t-test for matched samples • From raw data (Time 1 and Time 2)1. Find difference between those measurements for each subject. 2. Find average of the differences.3. Find the standard deviation of the differences.4. Use this S to find the standard error of the differences,
t-test for matched samples • (continued)5. Solve for t. 6. Compare this computed t to critical t (df=n-1) from t-table to see if significant difference between before and after scores.