Download
1 / 29
290 likes | 439 Views
NERACOOS: Unlocking the power of data. Riley Young Morse | Gulf of Maine Research Institute. NERACOOS Is:. The trusted source of regional ocean and weather information from Long Island Sound to the Gulf of Maine The Northeast Integrated Ocean Observing System (IOOS) – one of eleven regions

E N D
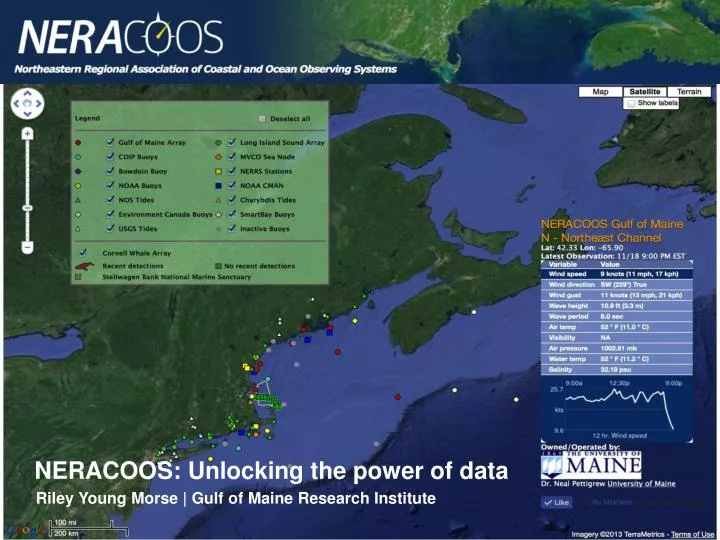
NERACOOS: Unlocking the power of data Riley Young Morse | Gulf of Maine Research Institute
NERACOOS Is: • The trusted source of regional ocean and weather information from Long Island Sound to the Gulf of Maine • The Northeast Integrated Ocean Observing System (IOOS) – one of eleven regions • A network of observers, modelers, forecasters, data managers, and product developers • With partners, produce practical solutions to real world problems that protect and enhance peoples’ lives, livelihoods and quality of life
NERACOOS has: a lot of data! • 8 active Gulf of Maine Buoys (reporting hourly/10 minutes on 10+ parameters since 1999 (GoMOOS) • 4 inactive (with varying time series from 2000-2007) • 6 active Long Island Sound Buoys (since 2006) • NECOFS Forecast system (30 year hindcast of Gulf of Maine) • Wave Watch III Forecast system • CODAR • Tide Stations • CO2 buoys • Nutrient sensors • HAB sensors • Gliders • Drifters
NERACOOSData Framework Goals: • Data accessibility • Provide highest QA/QC data • Utilizing IOOS/OGC standards for data services and metadata
Functionality • Data Access Portal • Filter on buoy/location/parameter • Quickly build time series graphs of data • Download filtered data in xls, csv • THREDDS • Services: SOS, WMS, WCS, OpenDAP, NetCDF, ISO • Raw file download, ncML metadata additions • ERDDAP • Data download: KML, XML, csv, xls, geoJSON
What is a Climatology? Climate in a narrow sense is usually defined as the "average weather," or more rigorously, as the statistical description in terms of the mean and variability of relevant quantities over a period of time ranging from months to thousands or millions of years. (WMO definition)
Climatology development process • Researched and reviewed various climatology examples • Survey conducted among diversity of potential users • Data managers at UMaine and UConn developed and implemented standard procedures for data preparation and statistical calculations • Web designer and developer at GMRI created visualization • User testing
Interactive Data Visualizations • Representations of information that allow the viewer to interact with the data. • Benefits: • They enable users to focus on interesting parts and details, to customize the content and even the graphical form, and to explore large amounts of data. • They can facilitate a playful experience that is way more engaging than static graphs and charts. • They enable users to learn at their own pace and answer their own questions. • Some of the best interactive data visualizations have been created by high tech major news organizations, and they tend to take advantage of modern web browsers. --http://visual.ly/what-is-an-interactive-data-visualization
NERACOOS Suggested Provisional Normal Guidelines • 15 October 2012 • Procedure: • Subsample all data to hourly values. No interpolation will be done on hourly values. • Daily Statistics: Calculate daily statistics from hourly values if there’s data for at least 18 hours for each day with no more than 4 consecutive hours missing . • Weekly Statistics: Calculate weekly statistics from hourly values if there are valid daily averages for at least 5 days. Number of valid days is used only as a check for valid weekly statistics and daily values are not used for computation of weekly statistics. Weeks start with the first day of the year and increment by seven days each week. Extra day(s) at the end of the year are included in the last week of the year. • Monthly Statistics: Calculate monthly statistics from hourly values if there are valid daily averages for at least 25 days with no more than 3 consecutive days missing. • Statistics: • count, mean, median, mode, min, max, stddev, pct0.5, pct02.5, pct97.5, pct99.5, IQR (25%, 50%) • Terminology: • Daily Averages: mean value from the Daily statistics (length of series = 365 days*nyears) • Daily Climatologies: mean of all daily averages for each day of the year (365 values) • Weekly Averages: mean value from the Weekly statistics (length of series = 52 weeks * nyears) • Weekly Climatologies: mean of all weekly averages for each week of the year (52 values) • Monthly Averages: mean value from the Monthly statistics (length of series = 12 months * nyears) • Monthly Climatologies: mean of all monthly averages for each month of the year (12 values)
Getting from data to product Climatologies statistics for each buoy/parameter/depth are calculated and output as csv to web folder by data provider --Ongoing daily/monthly means automated and updated to keep charts fresh AJAX loads the files into FLOT Javascript plotting library Does the rest… Scripts fetch and parse csv files from remote web server(s) --tabulate min/max calculations --combine climatology data (monthly/daily) and averages (monthly/daily) --output as JSON files (one file for each buoy/data type/depth, for monthly/daily)
Next steps • Add 2013 data to climatology • Refine product and implement additional functionality • Develop climatology information and display for other data types e.g. wind and current direction • Add additional locations (lightship data, FVCOM 30 year hindcast)
Integrated Sentinel Monitoring for Climate Change in Northeastern Coastal Ecosystems Goal:Todevelop a science and implementation plan for an adaptive sentinel monitoring program in the Northeast coastal region that integrates existing regional monitoring efforts, assets, and resources to assess the status and trends of key indicators at select sites and geographic subregions.
“The greatest value of a picture is when it forces us to notice what we never expected to see.” -John W. Tukey. Exploratory Data Analysis. 1977.