Download
1 / 35
360 likes | 471 Views
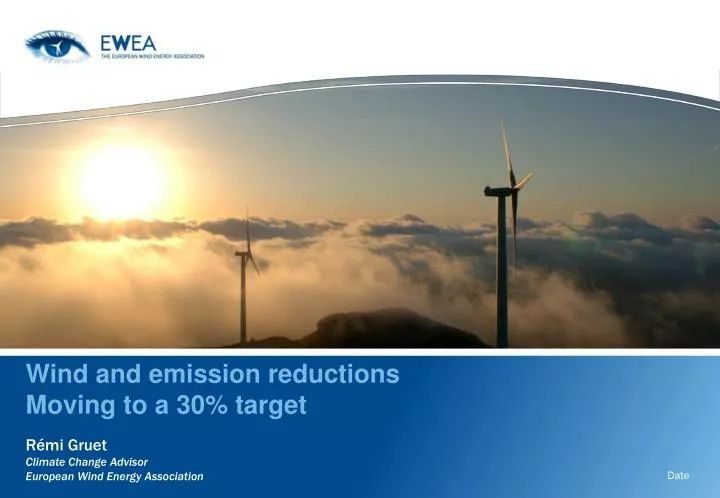
Wind and emission reductions Moving to a 30% target. Rémi Gruet Climate Change Advisor European Wind Energy Association. Date. Outline of presentation. Wind market status Prospective Wind growth and scenarios Wind-avoided CO2 in the EU Global Wind and a new climate agreement

E N D
Wind and emission reductions Moving to a 30% target Rémi GruetClimate Change Advisor European Wind Energy Association Date
Outline of presentation • Wind market status • Prospective Wind growth and scenarios • Wind-avoided CO2 in the EU • Global Wind and a new climate agreement • Additional content
Annual EU wind energy installations (in MW) 1MW = enough electricity for 750 average EU households Source: EWEA
Cumulative EU wind energy installations Source: EWEA
Net power capacity in the EU 2000-2008 Net = installations – decommissioning in MW Source: EWEA, EPIA and Platts Power Vision
New power capacity installed in 2008 TOTAL: 23,851 MW Renewables: 13,200MW Source: EWEA and Platts Power Vision
Cumulative wind power installations (end 2008) Source: EWEA, Pure Power (March 2008)
Outline of presentation • Wind market status • Prospective Wind growth and scenarios • Wind-avoided CO2 in the EU • Global Wind and a new climate agreement • Additional content
March 2009: EWEA increased its 2020 target from 180 GW to 230 GW (incl. 40 GW offshore) Rising energy demand and contribution from wind power 2000: 12.9 GW 2008: 66 GW 2020: 230 GW 14%-18% despite growing demand Demand: 4,107 TWh Two decades toinstall 0.9% of EUelectricity demand Demand: 2,577 TWh Accelerating pace: reaching 4.2% end 2008 Demand: 3,380 TWh Source: EWEA
2008 2009-2010 2011-2015 2016-2020 Annual EU wind power installations required to reach 230 GW by 2020 20 18 16 14 12 10 2008level GW 8 6 4 2 0 Source: EWEA
Outline of presentation • Wind market status • Prospective Wind growth and scenarios • Wind-avoided CO2 in the EU • Global Wind and a new climate agreement • Additional content
More wind – less CO ₂ • Wind energy avoids CO2-emissions • Wind produces CO2-free electricity, otherwise produced with gas, coal and oil power plants, which emit CO2 • Scenarios enable projections towards 2020 • Industrialised countries have emissions reduction targets • Kyoto Protocol – up until 2012 • 2020 targets (EU, Norway) How much of these reduction targets can wind achieve ? Source: DG TREN: Trends to 2030
Example: wind in the EU • Gas, coal and oil plants produce on av. 666 gCO2/kWh • Wind production avoids 2008: 137 TWh 91 Mt CO2 2012: 234 TWh 146 Mt CO2 2020: 582 TWh 333 Mt CO2 • Kyoto Protocol EU target 2008-2012 = 7.8% • 450 MtCO2e per year below 1990 emissions • EU Climate package target by 2020 = 20% 1160 MtCO2e in 2020 below 1990 emissions Source: EWEA, Pure Power (March 2008); DG TREN: Trends to 2030
20% of the EU’s Kyoto target EU - Wind power will avoid as much CO2 as... 2008 2012 2020 32% of the EU’s Kyoto target 29% of the EU’s 2020 target (20%)
From 2008-2020, wind will avoid 28% of the EU cumulative reduction efforts Wind-avoided CO2 Emissions: 28% EU-27’s Kyoto Target (7,8%) EU-27 2020 target Climate Package (20%) Emission Reduction Effort Wind-avoided CO2 = 32% of EU Kyoto target Wind-avoided CO2 = 29% of EU 2020 target … from Kyoto until 2012 and the climate package until 2020
EU 2020 – Wind power versus car emissions EU fleet - 214 million cars EU 2012 – Wind avoids 146 MtCO2, eq. to 46 million cars 20% of EU fleet ! EU 2020 – wind avoids 333 MtCO2, eq. to 168 million cars 80% of EU fleet !
Outline of presentation • Wind market status • Prospective Wind growth and scenarios • Wind-avoided CO2 in the EU • Global Wind and a new climate agreement • Additional content
At global level - Wind’s contribution to pledges for Copenhagen Current UNFCCC pledges + USA climate bill: 17%-20% of 2005 emissions = aggregated Annex I pledges 13%-20% of 1990 emissions Versus Global Wind in 2020 • 1081 GW installed capacity • 2650 TWh produced 1591 Mt CO2 avoided -22 to 25% Source: UNFCCC Secretariat – FCCC/KP/AWG/2009/10/Add.4/Rev.2
16% of Annex I 2008 Kyoto target Annex I - Global Wind in 2020 will avoid… 2008 2012 2020 44% of Annex I 2012 Kyoto target 65% of Annex I 2020 pledges (13%)
16% of Annex I 2008 Kyoto target Annex I – Global Wind in 2020 will avoid… 2008 2012 2020 44% of Annex I 2012 Kyoto target 42% of Annex I 2020 pledges (20%)
USA-China-India – target or deviation from BAU • For a 50% chance to stay below 2°C increase… • Developed countries 25%-40% from 1990 by 2020 • Developing countries 15-30% deviation from BAU • Projections for 2020 emissions in energy sector (Mt) Source: World Resource Institute – CAIT GHG Database
USA - Wind in 2020 will avoid as much CO₂ as 28 % of US pledge for 2020 US pledge = 17% from 2005 levels
China - 15% from BAU by 2020 (energy) Wind power can contribute… EIA IEA POLES …20% to 26% of China’s GHG reductions
India - 15% from BAU by 2020 (energy) Wind power can contribute… EIA IEA POLES …46% to 74% of India’s GHG reductions
Conclusion • Wind power will significantly reduce emissions, both in industrialised and developing countries. • Wind power will provide for a significant portion of the emissions reductions as pledged for a Copenhagen agreement, with existing legislation. Industrialised countries must review and raise their pledges for reduction targets More advanced developing countries should consider appropriate reductions from BAU
Thank you very much for your attention www.ewea.org RENEWABLE ENERGY HOUSE 63-65 RUE D’ARLON B-1040 BRUSSELS T: +32 2 546 1940 F: +32 2 546 1944 E: ewea@ewea.org
Additional content • Additional Climate slides • How a turbine comes together • Economics of Wind • Wind and employment • Wind innovations • EU wind map • Wind pictures • Environmental impacts • Wind and birds / bats • Spatial planning
EU ETS – New wind power (built after 2012) will avoid the equivalent of... 55% of the EU ETS target for the power sector in 2020 (20% target)1 1. Considering constant electricity consumption
Cost of generated power 1– Wind versus conventional Assumes CO2 costs: 25$/tCO2 Oil price : IEA2007 - 59$/barrel in 2010
Cost of generated power 2 – Wind versus conventional Assuming increased oil and CO2 prices Assumes CO2 costs: 35$/tCO2 Oil price doubled to 118$/barrel Coal price up 50%
Cost of generated power 3 –IEA forecast for the EU, in 2015 and 2030 Includes CO2 costs: 30$/MWh for coal and 15$/MWh for gas
How many jobs to expect from Wind ? • Jobs in the EU in Wind in 2008 • Direct jobs: 108 000 • Direct + Indirect jobs: 154 000 • Predicted jobs in the EU in Wind in 2020 • Direct jobs: 190 000 • Direct + Indirect jobs: 328 000