Download
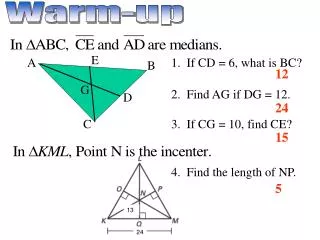
1 / 13
130 likes | 230 Views
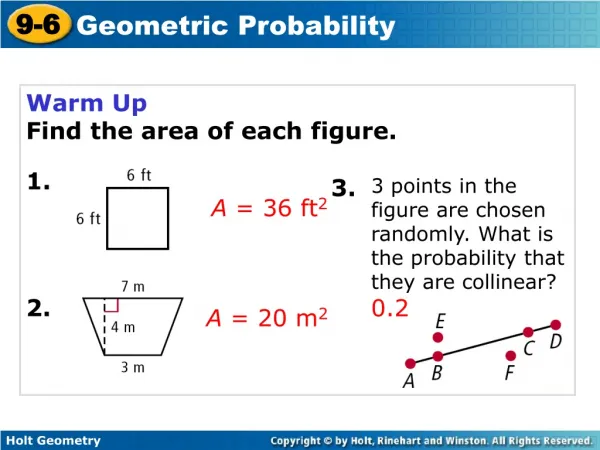
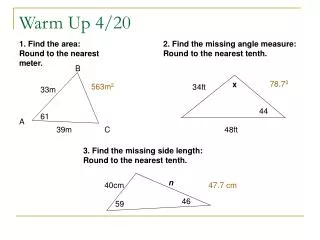
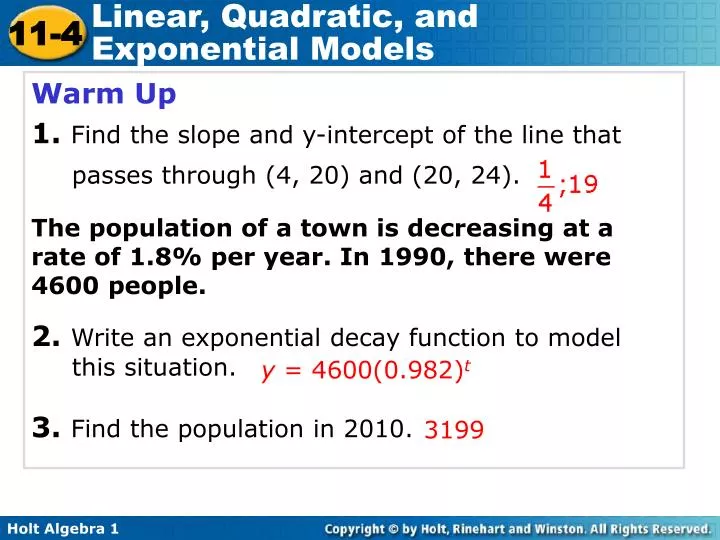
Warm Up 1. Find the slope and y-intercept of the line that passes through (4, 20) and (20, 24). The population of a town is decreasing at a rate of 1.8% per year. In 1990, there were 4600 people. 2. Write an exponential decay function to model this situation.

E N D
Warm Up 1. Find the slope and y-intercept of the line that passes through (4, 20) and (20, 24). The population of a town is decreasing at a rate of 1.8% per year. In 1990, there were 4600 people. 2. Write an exponential decay function to model this situation. 3. Find the population in 2010. y = 4600(0.982)t 3199
Learning Targets Students will be able to: Compare linear, quadratic, and exponential models and given a set of data, decide which type of function models the data and write an equation to describe the function.
Look at the tables and graphs below. The data show three ways you have learned that variable quantities can be related. The relationships shown are linear, quadratic, and exponential.
Look at the tables and graphs below. The data show three ways you have learned that variable quantities can be related. The relationships shown are linear, quadratic, and exponential.
Look at the tables and graphs below. The data show three ways you have learned that variable quantities can be related. The relationships shown are linear, quadratic, and exponential.
In the real world, people often gather data and then must decide what kind of relationship (if any) they think best describes their data.
Graph each data set. Which kind of model best describes the data?
Another way to decide which kind of relationship (if any) best describes a data set is to use patterns.
Look for a pattern in each data set to determine which kind of model best describes the data. Money in CD Height of golf ball
After deciding which model best fits the data, you can write a function. Recall the general forms of linear, quadratic, and exponential functions.
Use the data in the table to describe how the number of people changes. Then write a function that models the data. Use your function to predict the number of people who received the e-mail after one week. E-mail forwarding
Remember! • When the independent variable changes by a constant amount, • linear functions have constant first differences. • quadratic functions have constant second differences. • exponential functions have a constant ratio. HW pp. 793-795/8-19,23-39,32-40