Download
1 / 18
180 likes | 292 Views
Macroinvertebrate Communities in the ‘Wild & Scenic’ Reach of the Loxahatchee River. Loxahatchee River Watershed Science Symposium February 2001. Richard C. Dent, Mary S. Ridler and Lorene Bachman Loxahatchee River District.

E N D
Macroinvertebrate Communities in the ‘Wild & Scenic’ Reach of the Loxahatchee River Loxahatchee River Watershed Science Symposium February 2001 Richard C. Dent, Mary S. Ridler and Lorene Bachman Loxahatchee River District
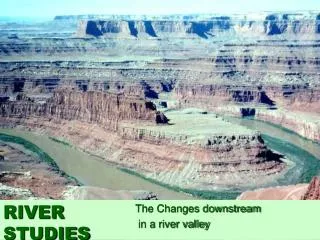
Figure #2 :Comparison of General Taxonomic Composition, Station #67 & Station #69 1991-1999
Figure #3 : Relative Presence of General Taxonomic Groups at Biological Sampling Station #69 123 Total Species Identified 1991-1999
Figure #4 : Relative Presence of General Taxonomic Groups at Biological Sampling Station #67 123 Total Species Identified 1991-1999
Major Taxonomic Groups Mean Number and Observation Frequency
Figure #5 : Temporal Trends for Select Metrics at Station #67 Metric value Time
Figure #6 : Temporal Trends for Select Indices at Station #67 Index value time
Figure #7 : Temporal Trends for Selected Metrics at Station #69 Metric value
Figure #8 : Temporal Trends for Select Indices at Station #69 Index value
Figure #9 : River Flow at Station #69 During Sampling Events 1991-99 Flow in cfs time
Figure #10 : Relative Presence of Functional Feeding Groups at Sta. #67
Figure #11 : Relative Presence of Functional Feeding Groups at Sta. #69
Figure #13 : Comparison of Analytical Results at Station #69 value
Figure #12 : Comparison of Analytical Results at Station #67 Value
Figure #14 : Comparison of Select Metrics for Two Related Sites Sampled Concurrently in 1992, 1993 and 1994 value
Typical Water Quality Conditions at Monitoring Stations 1991-1999