Download
1 / 39
390 likes | 585 Views
Low dimensional and nanostructured InGaAlAs materials for thermoelectric energy conversion. Zhixi Bian School of Engineering University of California, Santa Cruz zxbian@soe.ucsc.edu. Collaborators. R. Singh, M. Zebarjadi, Ali Shakouri (UC Santa Cruz)

E N D
Low dimensional and nanostructured InGaAlAs materials for thermoelectric energy conversion Zhixi Bian School of Engineering University of California, Santa Cruz zxbian@soe.ucsc.edu
Collaborators • R. Singh, M. Zebarjadi, Ali Shakouri (UC Santa Cruz) • J. M.O. Zide, A. C. Gossard (UC Santa Barbara, Delaware) • S. Singer, W. Kim, A. Majumdar (UC Berkeley, Yonsei University) • G. Zeng, J-H. Bahk, J.E. Bowers (UC Santa Barbara)
Outline • Thermoelectric effects • Low dimensional materials: superlattices • Nanoparticle materials • Summary
Thermoelectric Effects T2 T1 b Seebeck: a a V Q Q Peltier: b a a I
Application: microelectronics cooling DT=20C Mean-time-to-failure due to electromigration increase x5 80C 90C 108C Dependence of mean time to failure on temperature 110C 1 cm On chip temperature contour Steve Kang et al. Electrothermal analysis of VLSI Systems, Kluwer 2000
Application: optoelectronics cooling Fiber Optic Link:3200 Gbit/s 80 Lasers, 40 Gb/s per laser 0.8nm channel spacing Scheerer et al., Siemens AG, Elec. Lett. 35, (20, Sept. 1999) Dl ~ 0.8 nm • Optoelectronic device used in high-speed, multi wavelength fiber optic communication systems generate kW/cm2 and they need temperature stabilization. Typical DFB Laser: Dl/DT= 0.1 nm/oC, Heat generation kW/cm2
Challenge: integrated optoelectronics Temperature Change (C) +160C Standard Thermal Design V=0V V=2.7V Bias (V) SG - DBR Laser EA Front Rear Modulator Amplifier Mirror Gain Phase Mirror Light Out Q waveguide MQW active regions Sampled Grating Zhixi Bian, et al., Appl. Phys. Lett. 27, 3605 (2003)
Application: energy conversion Possible Applications • Electric power generator with no moving part • Electric Ships (Seapower 21) • Waste heat recovery (cars, power plants, …) • Microscale power sources
Thermoelectric figure-of-merit ZT Peltier Cooling Joule Heating Heat Conduction Net Cooling: Maximum Cooling: Terry M. Tritt et al., MRS Bulletin March 2006
Peltier cooling: microscopic picture Ef E E E ST Density of States Differential Conductivity f(E) d(E)
Optimal doping J. Snyder (2003) http://www.its.caltech.edu/~jsnyder/thermoelectrics/science_page.htm For almost all materials, if doping is increased, electrical conductivity increases but Seebeck coefficient is reduced.
Low dimensional materials (in-plane) Energy 2D Full band structure Inelastic scattering 1D Density-of-States D. A. Broido, T. L. Reinecke, Phys. Rev. B 64, 045324 (2001) [100] PbTe, QWell SL Bi [001] PbTe, QWire SL Dresselhaus M S et al, Microscale Thermophysical Engineering 3, 89 (1999).
Thermionic emission and MQW SL (cross-plane) Energy Hot electron Cold electron CathodeBarrierAnode Material 2 Single Barrier Material 1 Material 1 Thermionic: If barrier is thin or nanostructured (< electron energy relaxation length) => Can not define barrier Seebeck coef. independent of contact layers (ballistic, non-linear transport)
Non-planar barrier Emitter Collector Barrier Zhixi Bian et al., Appl. Phys. Lett. 88, 012102 (2006)
Peltier power profile Mona Zebarjadi et al., Phys. Rev. B74, 195331 (2006)
Multilayers and MQW superlattices Material 2 Superlattice Material 1 Material 1 • Reduced parasitic (contact) effects • Reduced thermal conductivity G. Chen, Phys. Rev. B 57, 14 958 (1998). M. V. Simkin and G. D. Mahan, Phys. Rev. Lett. 84, 927 (2000). R. Venkatasubramanian, E. Siivola, T. Colpitts, and B. O'Quinn, Nature413, 597 (2001). • Optimize electronic thermal conductivity Z. Bian, et al., Phys. Rev. B 76, 205311 (2007)
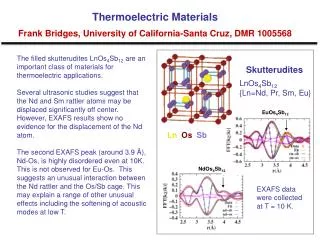
Interface scattering and coherence Bi2Te3/Sb2Te3 superlattices 2.5~25nm DT=32.2 K, ZT ~2-2.4 R. Venkatasubramanian, Nature413, 597 (2001). ~ phonon wavelength Superlattices Bulk R. Venkatasubramanian, Phys. Rev. B61, 3091 (2000) Power Factor (mW/cmK2) 40 50.9 Thermal Conductivity (W/mK) 0.5 1.26
InGaAs mm1.5/b m Mobility b Thermal conductivity m Electron effective mass Material Optimization for Heterostructure Integrated Thermionic Coolers, Ali Shakouri, Chris Labounty, Invited Paper, International Conference on Thermoelectrics, pp. 35-39, Baltimore, MD, August 1999.
ErAs/InGaAs-InGaAlAs for energy conversion 20nm n-InGaAs Cap layer 10nm InGaAlAs 20nm n-InGaAs 50nm 5E18 n-InGaAs n-InP substrate • The barrier height can be adjusted by Al composition • ErAs particles reduce the thermal conductivity (InGaAs) 0.6(InAlAs) 0.4 digital alloy ×70 (n-InGaAs) embedded with 0.3% Er nanoparticles randomly distributed (2×1018 cm-3) +Si dopants [(0-2-4-8)× 1018 cm-3]
Seebeck coefficients and modeling Zhixi Bian, et al., Phys. Rev. B 76, 205311 (2007)
Oscillation with doping • The thermoelectric power factor and electronic thermal conductivity can be optimized with doping and SL thickness
Phonon scattering by particles Bulk Alloy + Nanoparticles Bulk Alloy After W. Kim
Reduced thermal conductivity • Thermal conductivity is reduced by interface and nanoparticle scattering of phonons W. Kim et al., Appl. Phys. Lett.88, 242107 (2006)
Energy conversion module InP AlN Flip chip bonding InP AlN Substrate remove AlN Contact metal deposition on top of superlattice G. Zeng et al, Appl. Phys. Lett. 88, 113502 (2006)
Nanostructured materials PbTe/PbTeSe Quantum Dot Superlattices 0D confinement ???? Particle scattering of phonons/ electrons Ternary: ZT=1.3-1.6 Quaternary: ZT=2 DT=43.7 K, Bulk DT=30.8 K T.C. Harman et al., Science 297, 2229(2002) QDBulk PbTe Power Factor (mW/cmK2) 25.5 28 Thermal Conductivity (W/mK) 0.5 2.0
ErAs/InGaAlAs -- thermal In0.53Ga0.47As In0.53Ga0.47As 0.4 ML 40 nm 0.1 ML 10 nm 0.3 % ErAs 3.0 % ErAs 3.0 % ErAs:In0.53Ga0.28Al0.19As W. Kim et al., Phys. Rev. Lett.30, 045901 (2006)
ErAs/InGaAlAs -- electrical ErAs/InGaAs Conduction band edge • ErAs nanoparticles might dope the holding materials more efficiently • Free carrier concentration can be adjusted by particle size, and the holding material composition D. Driscoll (UCSB), PhD Thesis
(InGaAs)1-x(InAlAs)x—electrical conductivity • By changing the composition of Al, the carrier concentration can be adjusted • The carrier concentration also increases with temperature. This self-adaptability might offer an optimal material for a large temperature range 20% Al Measured at JPL with help from T. Caillat Substrate contribution is negligible <600K
(InGaAs)1-x(InAlAs)x- Seebeck coefficient • The Seebeck coefficient still increases with temperature, even the carrier concentration becomes larger 20% Al Measured at UCSC
(InGaAs)1-x(InAlAs)x—thermal conductivity I(ω) V(ω), V(3ω) 20% Al Measured at UC Berkeley
Power factor and ZT • Thermoelectric power factor increases and thermal conductivity decreases with the increase of temperature • A usually poor thermoelectric material achieves ZT ~1 at 600 K, when ErAs nanoparticles are embedded 20% Al
Where we are ErAs:InGaAlAs
Power generation module • Made by flip-chip bonding and wafer transfer at UCSB • 2.5 W/cm2 power output is demonstrated with the most recent module
Some modeling---scattering • Three major electron scattering mechanisms Electron energy By UCSB and UCSC
Some modeling---fitting • Fitting with experimental results with two parameters in nanoparticle scattering 20% Al
Some modeling---prediction • To improve the performance at ~400 K, smaller particle size might help Current sample After W. Kim, UC Berkeley
Improved thermoelectric power factor Poudel, B., et al. (2008). "High-Thermoelectric Performance of Nanostructured Bismuth Antimony Telluride Bulk Alloys." Science: 1156446
Power Factor (S2σT): 0.3% Er / control 0.3% Er:InGaAlAs Control (2E18 Si, no Er) 38
Summary • Thermoelectric materials have applications in thermal management and thermal-to-electrical energy conversion. • Low dimensional and nano structures may improve the thermoelectric performance. • We have made superlattices and nanoparticle materials using conventional semiconductor materials. • Apower generation density (2.5 W/cm2)have been achieved. • Similar material systems and optimal potential barrier, particle size and concentration may offer increased thermoelectric power factor besides reduced thermal conductivity, in turn, higher thermal to electrical energy conversion efficiency. • More accurate modeling of the thermoelectric effects of nanoparticles is ongoing.