Download
1 / 18
210 likes | 526 Views
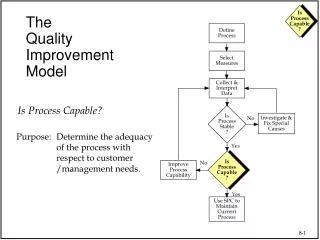
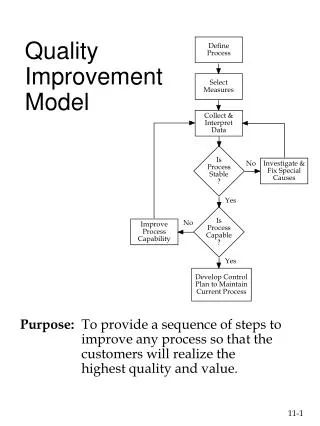
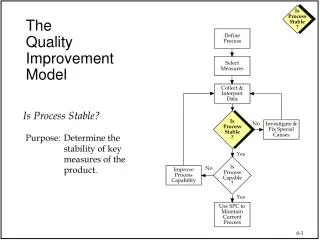
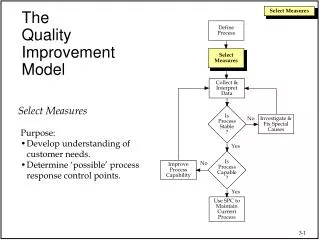
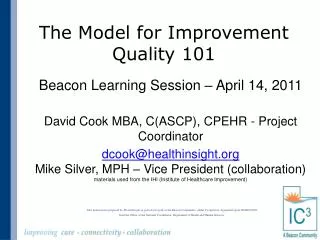
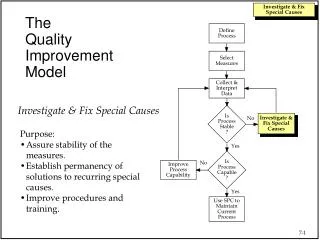
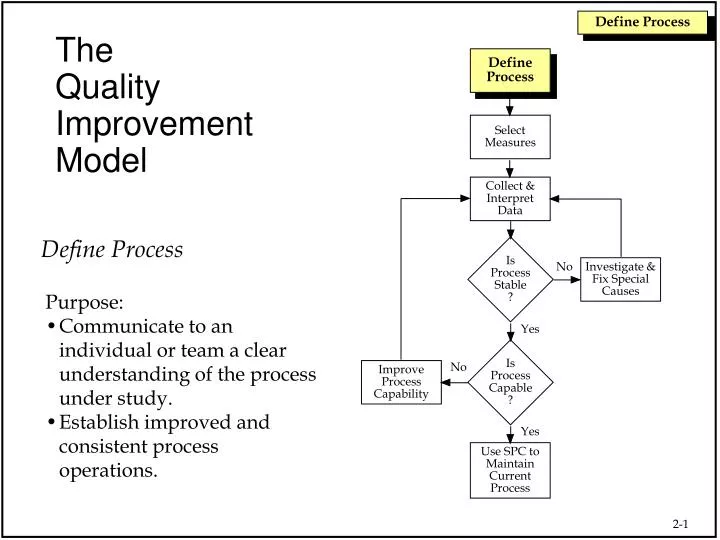
The Quality Improvement Model. Define Process. Select Measures. Collect & Interpret Data. Define Process. Is Process Stable ?. No. Investigate & Fix Special Causes. Purpose: Communicate to an individual or team a clear understanding of the process under study.

E N D
TheQualityImprovementModel Define Process Select Measures Collect & Interpret Data Define Process IsProcessStable? No Investigate & Fix Special Causes • Purpose: • Communicate to an individual or team a clear understanding of the process under study. • Establish improved and consistent process operations. Yes IsProcessCapable? No Improve Process Capability Yes Use SPC to Maintain Current Process
Inputs Outputs Suppliers Processes Customers Process Components • A process is any activity that converts • All processes involve Suppliers, Inputs, Outputs, and Customers
Defining Processes Why • Communicate to an individual or a team a clear understanding of the process under study. • Standardize process operations. How • Identify and list Suppliers, Inputs, Outputs, and Customers. • Develop flow chart of the process steps. • Assure a common understanding of related procedures. • Verify practice vs. procedure.
Process Standardization STANDARDIZATION is everyone following the procedures the same way. • Are not the optimum perfection. • Are not necessarily the current best known methods. • Are the agreed-upon methods. These Procedures: • “It is neither possible nor necessary to standardize all the operations. However, crucial elements...should be measurable and standardized.” • —Misaaki ImaiKAIZEN
Process Flow Charts End Purchasing Process Manufacturing Submits Purchase Order A Graphical display of the steps in a process. Purchasing Contacts Vendors for Pricing Vendor Submits Bids Discuss Quality vs. Price and Select Vendor Standard Symbols Can Vendor Meet Schedule? No Process Steps Yes Decisions Vendor Delivers Goods Manufacturing Inspects Goods Beginning or End Points, or Connectors between pages Purchasing Pays Vendor
Process Mapping Pumping String Up Outputs Chip weight Chip viscosity Chip defects Gels Dirt Shutdown/rate Filtration Quench Extrusion Cutting
Detailed Process Maps • What is the tool? • Graphical illustration of the process • What will the tool identify? • All value-added and non-value-added process steps • Input variables (X’s) • Output variables (Y’s) • Data collection points • When do you apply process mapping? • Always
Process Mapping Steps Identify the process, its external inputs and customer outputs Identify all steps in the process graphically List output variables at each step List input variables and classify process inputs as controlled or uncontrolled Add process specifications for input variables
Step 1: Identify the Process and Inputs/Outputs • We need to get a 50,000 ft. view of the process first • First identify the process in simple terms • Secondly we identify external inputs • Incoming information • Raw materials • Personnel • Energy requirements • Finally we identify the customer requirements (outputs) • Identify the attributes of a correctly functioning product or service
Step 1: Examples Inputs Outputs Manufacturing Fluid Bed Dryer Rate Temperature Air Flow Residence Time Appearance (Color ) Physical Chem Properties Cycle Time (plugging) Zone 3 Temp Non- Manufacturing Inputs Outputs Order Entry Phone FAX Email Price Availability Confirmation of Order Promise Date Order number
Step 2: Identify All Steps in the Process NADM Mixing Water and Metals Preparation Extrude through die Solution Preparation Answer Phone Order Entry Fluid Bed Dryer Greet customer Determine parts needed Identify need date Identify ship to address Identify price Identify shipment method Input information Print order confirmation Determine ship date Review order Final preparation / appearance issues Extrusion Impregnation Internal Information Order Confirmation Dryer Calciner Get internal P/N Determine terms Identify lead time Complete order worksheet FAX confirmation to customer Verify manufacturing receipt of order • Include all value-added and non value-added steps • Process steps, inspection/test, rework, scrap points Manufacturing Metals addition Material drying, surface area issues Non-Manufacturing
Step 3: List Key Output Variables • Include both process and product output variables Manufacturing Outputs Outputs NADM Mixing • pH • Temp • Specific Gravity • Clarity • Appearance (Color, Wetness) • Appearance (Color) • Physical Chemical Properties • Cycle Time (plugging) • Zone 3 Temp • TV of Mix -Quality Check around extrusion • TV of Mix - Quality Check around extrusion • Surface Area • Pore Volume • Appearance Water and Metals Preparation Extrude through die Solution Preparation Fluid Bed Dryer Final preparation / appearance issues Extrusion Impregnation Metals addition Dryer Calciner Material drying, surface area issues
Step 3: List Key Output Variables • Include both process and product output variables Non-Manufacturing Outputs Outputs • Order in computer • All line items complete • Correct info • Promise date • Order number • Printed confirmation Answer Phone • Prompt answer • Live body • Part number • Availability • Need date Order Entry • Greet customer • Determine P/N • Identify need date • Identify ship to address • Identify ship method • Input information • Print order confirmation • Determine ship date • Review order • Customer number • Order worksheet • Pricing • Order confirmation to customer • Order to production Order Confirmation Internal Information • FAX confirmation to customer • Verify manufacturing receipt of order • Get internal P/N • Determine terms • Identify lead time • Complete order worksheet
Step 4: List and Classify Key Input Variables • List all key input variables and classify them as • Controlled inputs • Uncontrolled inputs • Controlled Inputs: Input variables that can be changed to see the effect on output variables • Sometimes called “knob” variables • Uncontrolled Inputs: Input variables that impact the output variables but are difficult or impossible to control (may also be controllable, just not under control currently) • Example: Environmental variables such as humidity • Critical Inputs: Input variables that have been statistically shown to have a major impact on the variability of the output variables
Process Mapping Examples Manufacturing Outputs Outputs Inputs Types Inputs Types NADM Mixing Water and Metals Preparation Extrude through die Solution Preparation • pH • Temp • Specific Gravity • Clarity • Appearance (Color, Wetness) • Appearance (Color) • Physical Chemical Properties • Cycle Time (plugging) • Zone 3 Temp Nitric Acid C H2O2 C Water C ADM C Hold Time U Agitation C Phos Acid C Nozzle Type C Spray Time C Water C Moly C Nickel C Base C Temperature C Rate C Air Flow C Res Time C Total Rate C Mixer Speed C Al2O3 Qual U Rec Comp U Ext Rate C Die Wear U Ext RPMs C Die Change U Temperature C Rot speed C Draft C Feed Rate C Drying air U • TV of Mix -Quality Check around extrusion • TV of Mix - Quality Check around extrusion • Surface Area • Pore Volume • Appearance Fluid Bed Dryer Final preparation / appearance issues Extrusion Impregnation Metals addition Dryer Calciner Material drying, surface area issues
Process Mapping Examples Inputs Type Inputs Type • Order worksheet • Computer entry screens • Lead time information from mfg • Shipment method U C U C • Information from customer • Greeting script • Answering procedure • Telephone system C C C U Outputs Answer Phone Order Entry • Greet customer • Determine P/N • Identify need date • Identify ship to address • Identify ship method • Input information • Print order confirmation • Determine ship date • Review order • Cross reference for P/N’s • Order information • Plant loading information • Order worksheet form • Pricing algorithm C U U C C • Printed confirmation sheet • Production schedule • Customer contact info • Production contact info • Confirmation procedure C U C C C Order Confirmation Internal Information • FAX confirmation to customer • Verify manufacturing receipt of order • Get internal P/N • Determine terms • Identify lead time • Complete order worksheet Non-Manufacturing Outputs • Order in computer • All line items complete • Correct info • Promise date • Order number • Printed confirmation • Prompt answer • Live body • Part number • Availability • Need date • Order confirmation to customer • Order to production • Customer number • Order worksheet • Pricing
Step 5: Add Specifications for Inputs • For input variables identified as Controlled and Critical Inputs, we can add the operational specifications and targets for these variables • This information is the beginnings of the Control Plan!
Using Process Maps to Evaluate Processes • Understand customer/supplier relationships • Discover unnecessary steps • Achieve agreement on process • Everyone understands their role • Provides inputs to Cause and Effects Matrix • Provides inputs to Control Plan Summary • Provides inputs to Capability Summary • Excel template: Process Map Master.XLS