Download
1 / 48
480 likes | 604 Views
KINE 3301 Biomechanics of Human Movement. Effects of Exercise on Biological Tissues. Chapter 15. Structure of Bone. Osteocytes in cortical bone are encased in lamellar layers. Several layers wrap around each other to form an osteon or Haversian system.

E N D
KINE 3301 Biomechanics of Human Movement Effects of Exercise on Biological Tissues Chapter 15
Structure of Bone Osteocytes in cortical bone are encased in lamellar layers. Several layers wrap around each other to form an osteon or Haversian system. The Haversian system in the center of the osteon contains blood vessels and nerve fibers. Volkmann’s canal forms interconnections between adjacent osteons.
Osteons in Cortical Bone From: Gardinier JD, et al. In situ permeability measurement of the mammalian lacunar-canalicular system. Bone, 46: 1075-1081. Used with permission from Elsevier.
Relation between Load and Structural Alignment The alignment of cortical and cancellous bone tissue is arranged to withstand typical daily loads. Femoral image courtesy of Bartleby.com Inc.
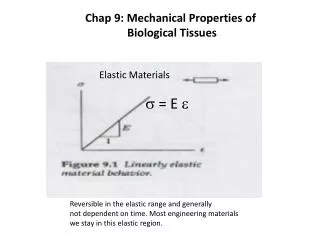
Stress – Strain for a Viscoelastic Material From: Stolken JS, Kinney JH. On the importance of geometric nonlinearity in finite-element simulations of trabecular bone failure. Bone, 33: 494-504, 2003. Used with permission from Elsevier
Canaliculi Form Intercellular Communication Network From: Tanaka-Kamioka K, et al. In situ permeability measurement of the mammalian lacunar-canalicular system. J Bone Min Res, 13: 1555-1568, 1988. Used with permission from Blackwell Science, Inc.
Stress – Strain for a Viscoelastic Material Osteocytes are embedded in osteons which are arranged around a central Haversian canal. Mechanical loading of bone generates fluid flow in the cannicular space, eliciting biochemical responses from the osteocytes to the imposed loads.
Material Testing System Images courtesy of Instron
Effects of Rate of Loading on Mechanical Response Viscoelastic tissues are stronger when loaded fast. The increased stiffness is attributed to the resistance of movement of fluid.
Objective of Adaptive Bone Remodeling • How does a region of bone cells determine the required strength for a region on bone? • During walking peak strains are less than 1000 με. • Strains in vigorous activities (landing, plyometrics) are 2000 – 3200 με (Fritton, 2000). • The objective of adaptive remodeling is to maintain bone cell alignment and structural density so that typical daily loads produce strains of 400 – 1000με.
Osteocytes Osteocytes are thought to inhibit osteoclasts from absorbing bone tissue. When a crack occurs the osteocyte network is no longer able to inhibit osteoclasts
What is the Advantage of Curved Bones? • A curved bone deforms in a predictable direction. • Increasing the magnitude of loading causes an increase in the osteogenic stimulus.
Measuring Bone Density with Dual-Energy X-Ray Absorptiometry (DEXA)
Understanding DEXA Results • For BMD the DEXA reports T and Z Scores • T Score: This number compares the amount of bone you have to a young adult of the same sex with peak bone mass. • The T score is used to define osteoporosis: • T −1 (T minus 1) or higher is normal • T − 2.5 to -1 is considered osteopenia • T − 2.5 and below is a diagnosis of osteoporosis • The T score can be used to estimate fracture risk: • T − 0 means your risk is the same as a normal 40 year old • T − 1 means your risk is twice as likely • T − 2 means your risk is four times as likely • T − 3 means your risk is eight times as likely • Z Score • This number compares the amount of bone you have to a person in your age group of the same sex and size.
Trabecular Bone Thinning with Osteoporosis From Mosekilde L. Age-related changes in bone mass, structure, and strength – effects of loading . Z Rheumatol, 59 (Suppl 1):1-9, 2000. Used with permission from SteinkopffVerlag.
Articular Cartilage From: Herzog et al. The role of muscles in joint degeneration and osteoarthritis J Biomech, 40 S1: S54-S63
Impact Loading & Osteoarthritis The rabbit’s leg was impacted with a force of 1.5 BW that reached a peak in 50 ms. One hour of impacts were delivered each day. In 36 days: Cortical bone on the ends of the bone thickened, cancellous bone became brittle, cartilage was thin or non-existent. From Radin EL, et al. Response of joints to impact loading – III. J Biomech, 6:51-57, 1973. Used with permission from Elsevier.
Radin’s Sheep • Adult sheep were subjected to prolonged activity on hard surfaces by walking them daily on concrete and housing them on tarmac. • Control sheep were walked on compliant wood chip surfaces and pastured. • After 9 months the sheep exposed only to concrete walked with a limp. • After 2 ½ years significant changes occurred: • Articular cartilage thinned or was non-existent. • Subchondral cortical bone thickened. • Trabecular pattern of cancellous bone was altered. • The increased cortical thickness and altered trabecular alignment stiffened the bone. Femoral condyle of sheep that walked on concrete Femoral condyle of sheep that walked on compliant wood chips Radin EL, Orr RB, Kelman JL, Igor LP, Rose RM. Effect of prolonged walking on concrete on the knees of sheep. J Biomech. 15:487-492, 1982.
Articular Cartilage From: Herzog et al. The role of muscles in joint degeneration and osteoarthritis J Biomech, 40 S1: S54-S63
Subchondral Bone Stiffening Cracks in articular cartilage are one of the first visible signs of the development of osteoarthritis. Radin & coworkers have suggested that subchondral bone stiffening may occur prior to any visible sign of the development of osteoarthritis. From: Herzog et al. The role of muscles in joint degeneration and osteoarthritis J Biomech, 40 S1: S54-S63
Principles of Health Bone Loading for Physical Education • Physical educators can optimize the osteogenic effect of exercise by incorporating exercises designed to stimulate healthy bone loading (McKay, et al. 2005). • Physical educators should follow these principles to optimize healthy bone loading: Children should perform 120 – 200 jumps / day, for 5 days/week. Different types of jumps should be performed each day or each week. For example: week 1 – jumping rope, week 2 – hopping…., week 3 – shuttle run… Static loads are not as effective as dynamic loads. Spreading the activity over 3 – 5 days is far more effective than doing the jumping/hopping activity all in one day. Adapted from: McKay HA et al. “Bounce at the Bell”: a novel program of short bouts of exercise improves proximal femur bone mass in early pubertal children. Br J Sports Med, 39(8): 521 – 526, 2005.
Biomechanical Descriptors of the Mechanisms of Injury • Minimum time for neuromuscular system to respond to a stimulus. • Magnitude of force. • Rate of force application. • Point of force application. • Direction of force application. • Number of repetitions of loading. • State of training (de-trained, immobilized, over-trained). • Critical limits of the tissue (warm-up, previous injury). • Magnitude of muscular preactivation.
Reflex Responses The minimum time of the neuromuscular system to respond to a stimulus is 80 – 200 ms. What happens when you go down a flight of stairs in the dark and you think you are at the bottom, but there is one more stair? This scenario illustrates the limitations of the neuromuscular system to respond to a stimulus.
Reflex Responses • The minimum time of the neuromuscular system to respond to a stimulus is 80 – 200 ms. • 30-120 ms from sensor (muscle spindle, GTO ..) to initiation of muscle tension • 50-300 ms for muscle to develop peak tension. • Additional time will be necessary to overcome the momentum of the body:
The Role In Muscles In Preventing Injury • Does strength training protect joints from injury? • Yes, but it depends upon the rate of loading and the magnitude of preactivation of the muscles. [Pope #226]
Critical Limits of the Tissue The Antero-Talofibular Ligament can withstand approximately 139 N. [Nordin & Frankel, p 247 3Ed]
Prior to ground contact the knee extensors are pre-activated to prepare for the collision with the ground. Muscular Preactivation
Muscular Preactivation EMG activity during landing from a drop height of 0.2 m with and without vision The rectified EMG recordings from the tibialis anterior, soleus, rectus femoris and biceps femoris muscles (TA, SO, RF and BF, respectively) during landings from a 0.2 m drop height are shown for ‘no vision’ and ‘vision’ conditions (left and right column, respectively). The traces are averages of five landings (subject 3). Dashed and continuous lines indicate take-off and touchdown, respectively. Calibration bars, expressed as a percentage of the EMG amplitude recorded during maximal voluntary contraction, apply to both landing conditions. From: Santello et al, Visual and non-visual control of landing movements in humans. J Physiol. 537 (Pt 1): 313-237, 2001.
Muscular Preactivation EMG activity during landing from a drop height of 0.8 m with and without vision Rectified EMG recordings from the TA, SO, RF and BF muscles during landings from a 0.8 m drop height are shown for ‘no vision’ and ‘vision’ conditions (left and right column, respectively). The traces are averages of five landings (subject 3). Dashed and continuous lines indicate take-off and touchdown, respectively. Calibration bars, expressed as a percentage of the EMG amplitude recorded during maximal voluntary contraction, apply to both landing conditions. From: Santello et al, Visual and non-visual control of landing movements in humans. J Physiol. 537 (Pt 1): 313-237, 2001.
Muscular Preactivaton Soleus preactivation 100 ms prior to ground contact. Tibialis anterior preactivation 100 ms prior to ground contact. From: Santello et al, The control of timing and amplitude of EMG activity in landing movements in humans. Exp Physiol. 83: 857-874, 1998.
Effects of Drop Height on Preactivation From: Santello et al., The control of timing and amplitude of EMG activity in landing movements in humans. Exp Physiol. 83: 857-874, 1998.
Muscular Preactivation in Running Runner increases muscular preactivation with increasing running speed.