Download
1 / 16
160 likes | 228 Views
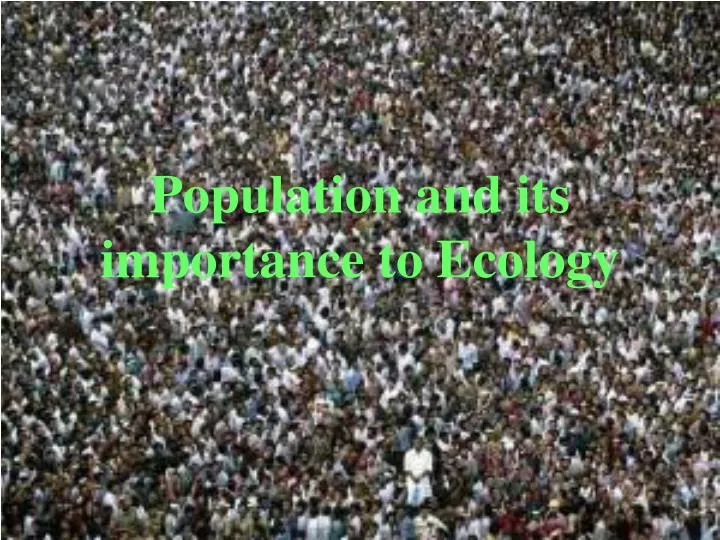
Population and its importance to Ecology. Demographers. These are scientists who study populations Talk about populations in terms of DENSITY Density- # of individuals of a species per unit area. 46/50 SD - 10.86 inhabitants per square mile 50/50 –AK - 1.264 inhabitants per square mile

E N D
Demographers • These are scientists who study populations • Talk about populations in terms of DENSITY • Density- # of individuals of a species per unit area 46/50 SD - 10.86 inhabitants per square mile 50/50 –AK - 1.264 inhabitants per square mile 1/50 – NJ - 1,189 inhabitants per square mile
Distribution of density • How spread out the population is • Random – no pattern (least common) • Dandelions blown by wind (chance) • Uniform – fairly evenly spaced • Penguins – aggressively territorial • Clumped – form small groups • Families or herds (most common)
Demographers use • Growth rate = birth rate - death rate • Per capita (1000) • Positive growth rate (+) - increasing (reds) • Negative growth rate (-)- decreasing (blues) Deer population in SD from 2000 – 2009
Population Growth Rate • Amount / Time • Depends on: • Birth rate and Death rate • Immigration (move into) • Emigration (move out) Is the world population still growing, even though the line graph is going down?
Density-dependent Factor-a factor that limits a population more as population density increases Examples: food, space • Density-independent Factors- factors that limit the population but are unrelated to population density Examples: Extreme weather
Exponential Growth • Larger it gets, the faster it grows • “J” Curve • No limiting factors(Something that restrains the population) • Doesn’t occur in realworld populations forvery long • EXAMPLES:
Bacterial Growth • If one bacterium divides to produce 2 cells every 20 min, how many bacteria would you have after just 1 day? • 0 min – 1 • 20 min – 2 • 40 min – 22 = 4 • 60 min – 23 = 8 • 1 day = 272 = 4,720,000,000,000,000,000,000 In a few days, bacteria would cover the planet
Logistic Growth • Accounts for influences of limiting factors • Birth rates and Death rates are not constant • Carrying Capacity- the maximum number of individuals an environment can support • “S” curve
3. 2. # organisms 1.
Phase 1 – Exponential Growth • unlimited resources, many offspring, few deaths • Phase 2 – Growth slows down • resources become limited, less offspring, growth rate starts to decrease • Phase 3 – Growth stops • rate of growth stops, pop. maintains size • # births = # deaths • Carrying capacity is reached
Populations Fluctuate in Nature • Small populations (Endangered species) • Siberian tigers, black footed ferret, California condor • Very vulnerable • Inbreeding-reduces genetic variation
Age structure - # of males and females of each age in a population - Shows how the population will grow over next few generations
Consider what the population of the world might be like in 20 years, 50 years, 100 years… What will be the limiting factors that cause us to reach our carrying capacity?