Download
1 / 45
450 likes | 577 Views
LESSONS LEARNED FROM EVALUATING NAVAJO NATION SURFACE WATER MEASUREMENT AND MONITORING SYSTEM. Little Colorado River Watershed Coordinating Council, Second Annual Winter Watershed Conference Show Low, Arizona January 28-30, 2009.

E N D
LESSONS LEARNED FROM EVALUATING NAVAJO NATION SURFACE WATER MEASUREMENT AND MONITORING SYSTEM Little Colorado River Watershed Coordinating Council, Second Annual Winter Watershed Conference Show Low,Arizona January 28-30, 2009 AREGAI TECLE (Northern Arizona University, Flagstaff, AZ), Gregg Garfin(University of Arizona, Tucson, AZ), Diana Anderson and Paul Heinrich (Northern Arizona University, Flagstaff, AZ), and John Leeper and Jolene Tallsalt-Robertson (Navajo Department of Water Resources, Fort Defiance, AZ.
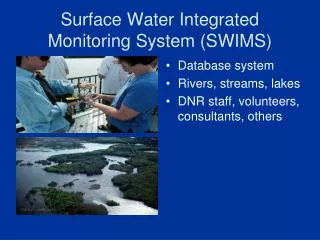
PRESENTATION INCLUDES: • Purposes for surface water measurement and monitoring • Measurement devices or approaches • Data types • Methods of data retrieval or collection • State of Navajo Nation stream flow measurement • Conclusions • Some recommendations
STREAM WATER COMES FROM SURFACE AND SUBSURFACE SOURCES. PRECISE MEASUREMENT OF THE STREAM DISCHARGE RATE IS NEEDED TO ACCURATELY ESTIMATE THE TOTAL AMOUNT OF WATER LEAVING A WATERSHED. Kinlichee Creekgauge
GENERAL DATA INADEQUACY CONCERN There are major concerns or perils due to absence, or inadequate, or reduced monitoring of the Nation’s streams and rivers (New York Times, April 11, 2006) There are many reasons for the need to know the amount and rate of stream flow. Flooding in Wisconsin on 6/9/2008
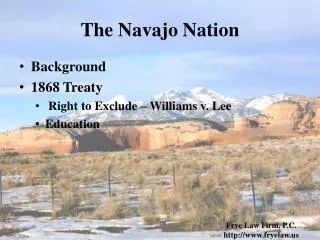
OVERARCHING REASONS FOR ACCURATE MEASUREMENT AND MONITORING SURFACE WATER IN THE NAVAJO NATION • Protect & manage Navajo Nation surface water resources for economic, social, cultural and spiritual benefits of the Nation • Improve the Nation’s capacity to monitor, plan and manage extreme hydrologic conditions (drought & flooding) Flooding in Wisconsin on 6/9/2008
SPECIFIC PURPOSES FOR STREAM FLOW MEASUREMENT • To enhance public safety by providing data for forecasting and managing flood events • To delineate and manage flood plains • To characterize current water-quality conditions • To operate and design multipurpose reservoirs - For domestic and agricultural water supply - For flood control - For energy generation - Recreation and wildlife habitat • To design highway bridges and culverts
SPECIFIC PURPOSES FORSTREAM FLOW MEASUREMENT –Cont. • To set minimum flow requirements to meet aquatic life goals (spawning area, food source, migration paths of fish and other wildlife) • To monitor compliance with minimum flow requirements • To develop or operate recreation facilities • To allocate water for municipal, industrial, and agricultural uses • To determine impacts of phreatophyte water consumption • To evaluate surface- and ground-water interactions • To facilitate long-term scientific studies of any changes in the hydrologic cycle
STREAMFLOW MEASURING DEVICES Structural example of a V-notch weir Flume used for small stream flow measurements Structure of a Parshall flume Various parts of a stilling well: left figure showing most appropriate location by a bridge to ensure channel stability; right figure shows the different parts of a stilling well.
STREAM FLOW MEASURING DEVICES - Continue Pressure transducer – installed submerged in the flow channel useful for long-term measurement and operation (may also be used with no cable as battery-operated) Utrasonic water level sensor – non-contact measurement of water surface elevation used for long term operation and monitoring (sensitive to disturbances) Electromagnetic current meter – advantageous in channels where fouling mechanical sensors is problematic Radar level sensor – non contact measurement of water surface, mostly used for long-term operation and measurement (sensitive to disturbance)
STREAM FLOW MEASURING DEVICES - Continue Mechanical (Pygmy) current meter for infrequent flow measurement – vertical axis Mechanical current meter – horizontal axis Current meter – acoustic doppler velocity meter – used for infrequent non-continuous water velocity measurement (has high accuracy) Price pigmy stream flow measuring device –done from a suspended position.
STREAM FLOW MEASURING DEVICES - Cont. Ultrasonic velocity with water level transducer –current meter. It is typically mounted in the channel bottom and measures water surface elevation and vertically-integrated velocity in small channels. Microwave water surface velocity gage – useful for water surface velocity measurement during high stage floods. Bubble manometer – the manometer shelter can be located at a distance from the water’s edge in a safe location and the orifice may be easily moved to follow changing stream channel. Gas bubbles keep the orifice from getting covered by sediment
DOMSAT GOES Remote hydrologic Stations User Operations Wallops, Virginia Command and Data Acquisition Center ( Internet ) Stage After Chris Smith, USGS (2008)
DATA TYPES • Snow water equivalent • Stream flow data - Stage height - Event stream flow rate or discharge rate - Cumulative or total stream flow amount
SOURCES OF INFORMATION USED IN THIS PRESENTATION • On-site examination of stream flow gaging sites and instruments • Relevant literature review • Interview of relevant personnel (NNDWR, USGS and NWS) • Historical data acquisition • Evaluation of NNDWR stream flow data collection, reporting, communication, and integration needs • Comparing data from USGS and NDWR operated gauges
CHUSKA AGRICULTURE CASE STUDY Observed Changes:Decreased snow, soil moisture, and irrigation supply since 1999 – Cessation of farming Rachael Novak, CLIMAS and Univ. Arizona Geosciences
STREAMFLOW MEASUREMENT TYPES • Stage height – height of the water in a stream above a certain baseline in feet or meter. • Stream flow or discharge – is volume flow of water (in cubic • Feet or meter cubic) moving past a cross-section of a stream during a specific period of time (in seconds), hence the rate of discharge is cubic feet per second. • Rating curve – A graphical representation of the relationship between the stage height and the discharge rate of a stream flow. Crane, current meter, and weight used to measure the stream flow rate from a bridge. River bed
OBSERVATIONS ON OPERATIONAL STREAM GAGES AND ASSOCIATED DATA QUALITY IN THE NAVAJO NATION Black Creek
CHARACTERISTICS THAT INFLUENCE DATA QUALITY AND RELIABILITY • INSTRUMENT RELIABILITY • INSTRUMENT MAINTENANCE • DATA HANDLING • DATA PROCESSING • DATA ACCESSIBILITY (Location) • SPATIAL DISTRIBUTION AND REPRESENTATIVENESS OF DATA • KNOWLEDGEABLE AND DEDICATED PERSONNEL AVAILABILITY • MAINTENANCE OF FACILITY Captain Tom wash gage
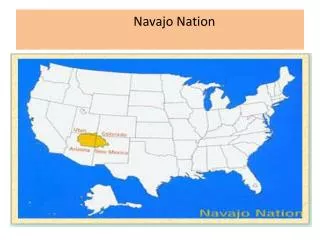
Gages are concentrated mainly on streams draining the Chuska Mountains, which is a small part of the Navajo Nation.
BLACK CREEK:GAGE CONDITION Instrument has been operating continuously, however, data recording has been interrupted a number of times Concerns with the gaging station • Channel invasion by Exotic vegetation • Channel bed sediment accumulation • Channel aggredation & degradation Sediment accumulation Stilling well & vegetation
ASSAYI CREEK: GAGE CONDITION Concerns with Assayi Creek gage 1. Invasion by vegetation 3. Data have not been regularly 2. Sediment accumulation taken and processed June 2007
ASSAYI CREEK DATA The graph on the left shows sporadic stream flow data while the dotted graph on the right shows stage-discharge relationship of the recorded data. The chart shows little flows for high stage which may be due to errors in data recording or instrument reading or due to large amount of sediment accumulation.
CHINLE CREEK:GAGE CONDITION Stilling well Note stream bed sediment accumulation
CHINLE CREEK: GAGE CONDITION-Cont Three major concerns are apparent in this gauging station: 1) stream braiding resulting in most of the flow taking place away from the gauge, 2) lots of sediment accumulation and 3) stream bottom plant and tree growth The consequences of these conditions are both under and over estimation of stream flow streambed vegetation invasion Flow a way from gage
CHINLE CREEK DATA The graph on the left hand side shows the sporadic nature of the data collected form the gage at Chinle, and there is little one can do with such data. The dotted graph of stage-discharge relationship on the right shows low correlation between the two forms of stream flow measurement, which reflects the channel problem.
WHEATFIELDS CREEK: GAGE CONDITION The gauge is in a stable cross-section. However there is a great deal of vegetation invasion above the bankful stage to affect the accuracy of a stream flow measurement. As in the other gages, we do not have a continuous record to make much sense of the data. The higher correlation between stage and discharge at low flows comopared to at higher flows is reflective of the stream cross-section. It is stable near the bottom of the stilling well but have vegetation at higher level.
LUKACHUKAI CREEK: GAGE CONDITION As with the data from the other gauging stations those from Lukachukai Creek have not followed proper protocol to provide any important information on the stream flow nor can they be used in any modeling or decision-making process. The order less scatter of the stage-discharge relationship points on the right hand side graph shows the poor gaging station condition. Large sediment accumulation and in-channel vegetation growth give a false high stage height. Observe the tremendous amount of sediment accumulation along the stream bed. There is also plenty of vegetation growth along the stream bed.
CAPTAIN TOM Wash: GAUGE CONDITION There are lots of boulders in the stream cross-section where the stilling well is located. We could also see the sediment accumulation inside the stilling well. These along with the vegetation in the stream can affect the reliability of the flow data significantly. They need to be cleaned.
WHISKEY CREEK: GAUGE CONDITION The flume in this station has some vegetation growth problems, but it is relatively in good condition. The stage-discharge data on the right shows this relatively good condition.
TSAILE CREEK This is one of Navajo Nation’s Safety of Dams automated stations that provide real-time data to protect lives and property. Where gaged stream channels are stable and well maintained, long-term data can be generated to forecast extreme hydrological events such as drought and flood periods.
TSAILE CREEK Detail of the state-of-the-art automated streamgage and weather Station instrumentation at Tsaile Creek.
TSAILE CREEK DATA The measured stream flow record for the gage at Tsaile is sporadic like those in most of the other NNDWR-operated gages. However the condition of the stream makes the stage-discharge points on the right look good. In this situation as in others, there is a need for continuous data collection and processing.
KINLICHEE CREEK: GAUGE CONDITION The gauge at kinlichee Creek is located under a bridge which is stable with no vegetation growth and little sediment accumulation. The effect can be see in the near-perfect stage-discharge relationship curve below
LITTLE COLORADO RIVER NEAR CAMEROON: ANOTHER EXAMPLE OF A USGS-OPERATED STREAM GAUGE
SAN JUAN RIVER STREAM FLOW CHARACTERISTICS The San Juan River gage is operated by the USGS. Compared to those operated by the NNDWR, the data can be used for many purposes. Here we use it to show the wet season in the lower right hand side and to show the decreasing stream flow (or drying) condition with time in the lower left hand side. The 3-D figure to the right shows the monthly average stream flow for 27 years. The figure also shows periods of high and low flows as well as its persistent unimodal nature. We can also use the data for modeling water yield and peak flow or flood forecasting
STATION INSTALLATION AND RETENTION CRITERIA There are many criteria to consider when installing or retaining a gauging station: These include: Presence of population centers around or downstream of the station sites Present or future presence of reservoirs downstream of the potential or existing station sites Value in the data for recreation and tourism enterprises Present or potential presence of large irrigated areas nearby the station Multiple versus single use of stations Potential for additional uses of the station Easy access to station location Proximity of station location to telecommunications Location of station in a unique or important ecosystem Station data reliability (are many data missing from the station)
STATION INSTALLATION AND RETENTION CRITERIA-Cont. Presence of high density stations in close proximity High potential for land ownership or where the station becomes prone to vandalism Usefulness of station to wildlife monitoring efforts High potential (or a history) of site for high wildlife habitat disturbance Capability of station location, or the length of station record to facilitate climate change monitoring Excessive cost of operating and maintaining station Educational and research values of station Possibility for area economic development support of station
CURRENT DEVELOPMENT EFFORTS • Working with NAU AND UofA on hydroclimate data acquisition capacity building • Collaborating with the USGS on stream gaging and data collection • Collaborating with NWS to acquire and locate NOAA Weather Radio stations and other facilities • Continuous BIA funding and assistance to continue develop weather, water, and climate data acquisition and processing capacity • Collaborating with Corps of Engineers on watershed modeling • Collaboration with private companies and individuals as well as other federal and state agencies
CONCLUDING REMARKS The condition of the different streams and the gauging facilities in the Navajo Nation and the data gathered from those streams tell us many things. 1. The stream gauges operated by the Navajo Nation are all functioning, however, 2. The stream reaches where the gauges are located are not well maintained to provide reliable data - data are not gathered in a consistent and continuous manner and even if they were - the data from most of the gages need proper processing for any use in decision making 3. The available gauges are concentrated in a very small portion of the Nation to represent the hydrologic conditions in the Navajo Nation 4. The main reasons for the problems are inadequate funding and shortage of manpower to properly operate existing gages, install new ones, process and make data available for various uses. 5. Poor sampling leads to poor understanding of weather, water, and climate issues.
CONCLUDING REMARKS – Cont. 6. Limits ability to help save lives and property. 7. Present gages are restricted to small areas; data would be needed to represent varying climatic, topographic and land use areas 8. Some gaging stations are not in good shape 9. Shortage of NWS retrievable climate data for hydrologic forecasting purposes 10. Data needed for various development needs as indicated next.
SOME RECOMMENDATIONS Since availability of accurate and reliable stream flow data are important for the various reasons stated previously, we recommend: 1. That having adequate hydrological information be a priority since many important situations such as accurate flood forecasting, proper reservoir operation, reliable estimation of agricultural and domestic water supplies, drought management as well as satisfactory wildlife and ecosystem maintenance and management depend on it; 2. Obtain adequate funding for existing instrument maintenance, personnel training and hiring new employees; 3. Ensure that data gathered from existing gages are properly processed and analyzed following properly protocol and make it available for others to use; 4. In the long-term, obtain funds for installing gauges in streams that are not gauged at present.
RECOMMENDATIONS – Cont. 5. Enhance data communication – telemeter data in near real-time – this will enhance usability and quality control; 6. Incorporate Navajo Nation data with USGS data to provide reliable forecasting system; 7. Develop a collaborative effort among local (Navajo) and relevant state and federal agencies to work together to ensure availability of needed hydrological information for various uses; 8. Develop ecosystem-based and multiobjective water resources management.