Download
1 / 1
10 likes | 111 Views
Seasonal variability in the growth rates of euphausiids from the northern Gulf of Alaska. A.I. Pinchuk * , R.R. Hopcroft, K.O. Coyle Institute of Marine Science, University of Alaska Fairbanks, AK 99775-7220 *e-mail: ftaip1@uaf.edu. Abstract

E N D
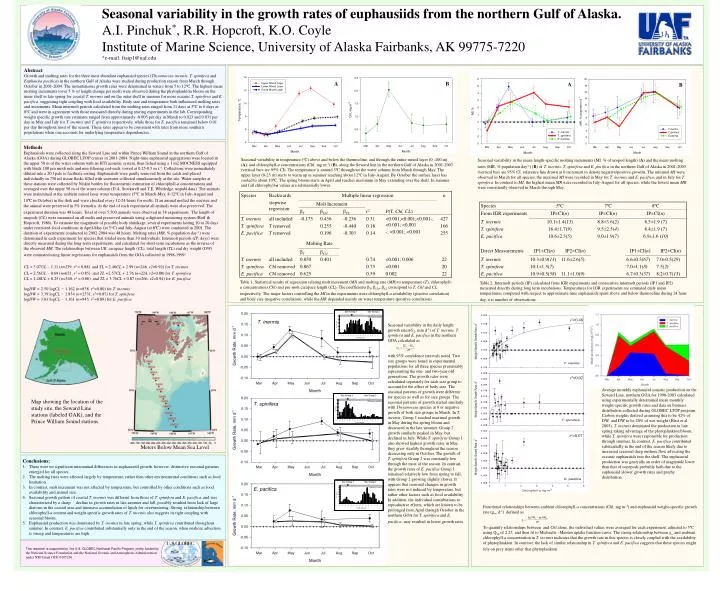
Seasonal variability in the growth rates of euphausiids from the northern Gulf of Alaska. A.I. Pinchuk*, R.R. Hopcroft, K.O. Coyle Institute of Marine Science, University of Alaska Fairbanks, AK 99775-7220 *e-mail: ftaip1@uaf.edu Abstract Growth and molting rates for the three most abundant euphausiid species (Thysanoessa inermis, T. spinifera and Euphausia pacifica) in the northern Gulf of Alaska were studied during production season from March through October in 2001-2004. The instantaneous growth rates were determined in waters from 5 to 12ºC. The highest mean molting increments (over 5 % of length change per molt) were observed during the phytoplankton bloom on the inner shelf in late spring for coastal T. inermis and on the outer shelf in summer for more oceanic T. spinifera and E. pacifica, suggesting tight coupling with food availability. Body size and temperature both influenced molting rates and increments. Mean intermolt periods calculated from the molting rates ranged from 11 days at 5ºC to 6 days at 8ºC and were in agreement with those measured directly during rearing experiments in the lab. Corresponding weight specific growth rate estimates ranged from approximately -0.005 per day in March to 0.023 and 0.031 per day in May and July for T. inermis and T. spinifera respectively, while those for E. pacifica remained below 0.01 per day throughout most of the season. These rates appear to be consistent with rates from more southern populations when one accounts for underlying temperature dependencies.. A B A B Methods Euphausiids were collected along theSeward Line and within Prince William Soundin the northern Gulf of Alaska (GOA) during GLOBEC LTOP cruises in 2001-2004. Night-time euphausiid aggregations were located in the upper 50 m of the water column with an HTI acoustic system, then fished using a 1 m2 MOCNESS equipped with black 100 μm mesh nets and non-filtering cod-ends, towed at 0.25-0.5 m s-1. Collections were immediately diluted into a 20 l pale to facilitate sorting. Euphausiids were gently removed from the catch and placed individually in 750 ml tissue flasks filled with seawater collected simultaneously at the site. Water samples at these stations were collected by Niskin bottles for fluorometric estimation of chlorophyll-a concentrations and averaged over the upper 50 m of the water column (D.A. Stockwell and T.E. Whitledge, unpubl.data). The animals were maintained at the ambient mixed layer water temperature (5ºC in March-May, 8-12ºC in July-August and 10ºC in October) in the dark and were checked every 12-24 hours for molts.If an animal molted the exuviae and the animal were preserved in 5% formalin. At the end of each experiment all animals were also preserved. The experiment duration was 48 hours. Total of over 5,500 animals were observed in 38 experiments.The length of uropods (UL) were measured on all molts and preserved animals using a digitized measuring system (Roff & Hopcroft, 1986). To estimate the magnitude of possible body shrinkage, several experiments lasting 10 to 20 days under restricted-food conditions in April-May (at 5°C) and July-August (at 8ºC) were conducted in 2001. The duration of experiments conducted in 2002-2004 was 48 hours. Molting rates (MR, % population day-1) were determined in each experiment for species that totaled more than 30 individuals. Intermolt periods (IP, days) were directly measured during the long-term experiments, and calculated for short-term incubations as the inverse of the observed MR. The relationships between UR, carapace length (CL), total length (TL) anddry weight(DW) were estimated using linear regressions for euphausiids from the GOA collected in 1998-1999: CL = 3.07UL – 1.11 (n=239, r2 = 0.88) and TL = 2.46CL + 2.99 (n=246, r2=0.92) for T. inermis CL = 2.56UL – 0.69 (n=621, r2 = 0.85) and TL =2.57CL + 2.76 (n=224, r2=0.88) for T. spinifera CL = 1.48UL + 0.25 (n=340, r2 = 0.86) and TL = 3.76CL + 0.87 (n=266, r2=0.94) for E. pacifica logDW = 2.50logCL − 1.162 (n=838, r2=0.80) for T. inermis logDW = 3.39logCL − 1.854 (n=2531, r2=0.87) for T. spinifera logDW = 3.03logCL − 1.161 (n=945, r2=0.89) for E. pacifica Seasonal variability in temperature (oC) above and below the thermocline, and through the entire mixed layer (0 -100 m) (A); and chlorophyll-a concentrations (Chl, mg m-3) (B), along the Seward line in the northern Gulf of Alaska in 2001-2003 (vertical bars are 95% CI). The temperature is around 5ºC throughout the water column from March through May. The upper layer (0-25 m) starts to warm up in summer reaching about 12ºC in July-August. By October the surface layer has cooled to about 10ºC. The spring bloom starts in April and reaches maximum in May extending over the shelf. In summer and fall chlorophyll-a values are substantially lower. Seasonal variability in the mean length-specific molting increments (MI, % of uropod length) (A) and the mean molting rates (MR, % population day-1) (B) ofT. inermis, T. spinifera and E. pacifica in the northern Gulf of Alaska in 2001-2003 (vertical bars are 95% CI, reference line drawn at 0 increment to denote negative/positive growth). The minimal MI were observed in March for all species, the maximal MI were recorded in May for T. inermis and E. pacifica, and in July for T. spinifera. In contrast to MI, the highest mean MR were recorded in July-August for all species, while the lowest mean MR were consistently observed in March through May. Map showing the location of the study site, the Seward Line stations (labeled GAK), and the Prince William Sound stations. Meters Below Mean Sea Level Table 1. Statistical results of regression relating molt increment (MI) and molting rate (MR) to temperature (T), chlorophyll-a concentration (Chl) and pre-molt carapace length (CL). The coefficients βT, βChl, βCL correspond to T, Chl and CL respectively.The major factors controlling the MI in the experiments were chlorophyll-a availability (positive correlation) and body size (negative correlation), while the MR depended mainly on water temperature (positive correlation). Table 2. Intermolt periods (IP) calculated from IGR experiments and consecutive intermolt periods (IP1 and IP2) measured directly during long term incubations. Temperatures for IGR experiments are estimated daily mean temperatures computed with respect to approximate time euphausiids spent above and below thermocline during 24 hour day, n is number of observations. Size Group 1 Size Group 2 r2=0.48 Seasonal variability in the daily length growth rates(GL, mm d-1) of T. inermis, T. spinifera and E. pacifica in the northern GOA calculated as with 95% confidence intervals noted. Two size groups were found in experimental populations for all three species presumably representing the one- and two-year old generations. The growth rates were calculated separately for each size group to account for the effect of body size. The seasonal patterns of growth were different for species as well as for size groups. The seasonal patterns of growth started similarly with Thysanoessa species at 0 or negative growth of both size groups in March. In T. inermis, Group 1 reached maximal growth in May during the spring bloom and decreased in the late summer. Group 2 growth similarly peaked in May, but declined in July. While T. spinifera Group 1 also showed highest growth rates in May, they grew steadily throughout the season decreasing only in October. The growth of T. spinifera Group 2 was constantly low through the most of the season. In contrast, the growth rates of E. pacifica Group 1 remained relatively low from spring to fall, with Group 2 growing slightly slower. It appears that seasonal changes in growth rates were not induced by temperature, but rather other factors such as food availability. In addition, the individual contributions to reproductive efforts, which are known to be prolonged from April through October in the northern GOA for T. spinifera and E. pacifica, may resulted in lower growth rates. Size Group 1 Size Group 2 r2=0.02 Size Group 1 Size Group 2 Average monthly euphausiid somatic production on the Seward Line, northern GOA for 1998-2003 calculated using experimentally determined mean monthly weight-specific growth rates and data on biomass distribution collected during GLOBEC LTOP program. Carbon weights derived assuming this to be 42% of DW, and DW to be 20% of wet weight (Hirst et al 2003). T. inermis dominated the production in late spring taking advantage of the phytoplankton bloom, while T. spinifera were responsible for production through summer. In contrast, E. pacifica contributed substantially in the end of the season likely due to increased seasonal deep onshore flow advecting the oceanic euphausiids into the shelf. The euphausiid production was generally an order of magnitude lower than that of copepods probably both due to the euphausiid slower growth rates and patchy distribution. r2=0.07 • Conclusions: • There were no significant interannual differences in euphasusiid growth, however, distinctive seasonal patterns emerged for all species. • The molting rates were affected largely by temperature, rather then other environmental conditions such as food limitation. • In contrast,molt increment was not affected by temperature, but controlled by other conditions such as food availability and animal size. • Seasonal growth pattern of coastal T. inermis was different from those of T. spinifera and E. pacifica, and was characterized by a sharp decline in growth rates in late summer and fall, possibly resulted from lack of large diatoms in the coastal area and intensive accumulation of lipids for overwintering. Strong relationship between chlorophyll-a content and weight-specific growth rates of T. inermis also suggests its tight coupling with seasonal bloom. • Euphausiid production was dominated by T. inermis in late spring, while T. spinifera contributed throughout summer. In contrast, E. pacifica contributed substantially only in the end of the season, when onshore advection is strong and temperatures are high. Functional relationships between ambient chlorophyll-a concentrations (Chl, mg m-3) and euphausiid weight-specific growth rate (gw, d-1) defined as To quantify relationships between and Chl alone, the individual values were averaged for each experiment, adjusted to 5ºC using Q10 of 2.25, and then fit to Michaelis –Menten uptake function curve. The strong relationship between gwand ambient chlorophyll-a concentration in T. inermis indicates that the growth rate in this species is closely coupled with the availability of phytoplankton. In contrast, the lack of similar relationship in T. spinifera and E. pacifica suggests that these species might rely on prey items other that phytoplankton. This research is supported by the U.S. GLOBEC Northeast Pacific Program, jointly funded by the National Science Foundation and the National Oceanic and Atmospheric Administration under NSF Grant OCE-0105236.