Download
1 / 4
40 likes | 48 Views
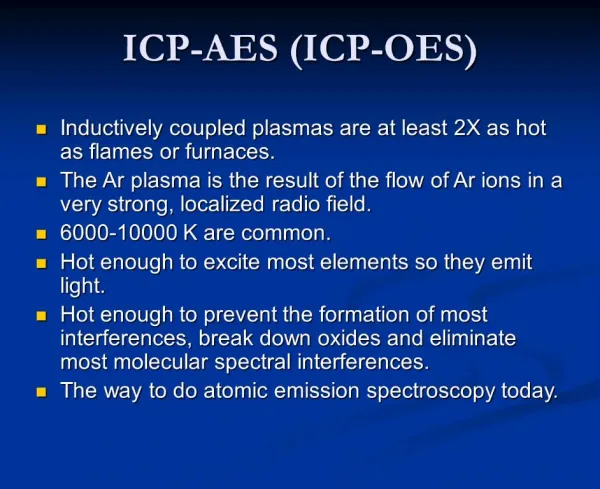
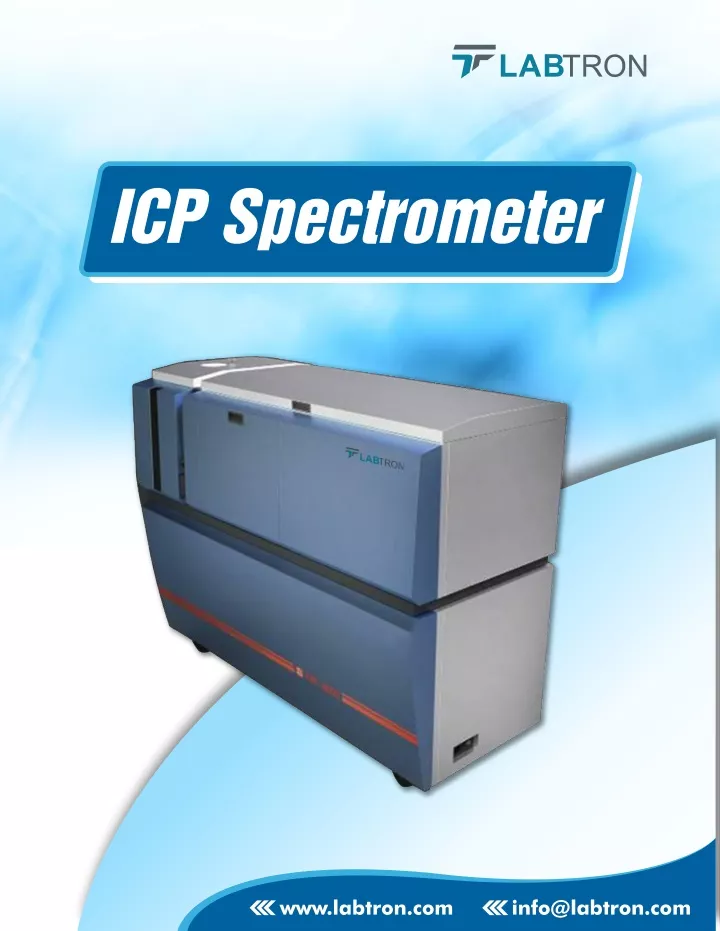
ICP spectrometer LICP-A10 detects trace elements using argon plasma where the atomized liquid sample is injected. With an analyzing rate of 26 elements per minute results can be achieved with lower levels of detection and measurement of trace and ultra-trace elements. Elements can be traced from liquid and solid samples. Detection of liquid flow from the spray chamber by optical drain sensor offers exceptional sensitivity and accuracy.<br><br>

E N D
www.labtron.com info@labtron.com
ICP Spectrometer LICP-A10 ICP spectrometer LICP-A10 detects trace elements using argon plasma where the atom- ized liquid sample is injected. With an analyzing rate of 26 elements per minute results can be achieved with lower levels of detection and measurement of trace and ultra-trace elements. Elements can be traced from liquid and solid samples. Detection of liquid flow from the spray chamber by optical drain sensor offers exceptional sensitivity and accuracy. Features Scanning range variance ( 190 nm to 500 nm / 190 nm to 800 nm ) Rapid analysis – 26 elements per minute Temperature range – 20 to 28 °C Optical pathway – Czerny-turners Low detection limit Detection of multi-elements including non-metallic Single and multi-element measurement method Indication for wavelength error and repeatability Range of measurement – common to trace Applications Used in clinical analysis for detection of metals in biological fluids , environmental analysis for trace element detection in water , soil , plants , pharmaceuticals for traces of catalysts and poison metals like Cd , Pb , industries for noble metal detection
Specification Model No LICP-A10 180 to 500 nm Wavelength range ( 3600 lines / mm ) 180 to 800 nm Wavelength range ( 2400 lines / mm ) 20 ~ 28 0C Temperature 26 elements Elements per minute 70 % Humidity 1000 mm Focal length RSD ≤ 1.0 % Standard deviation ≥ 0.9998 Correlation coefficient Argon ( 99.99 % ) Gas source 100 ~ 1000 L / h Plasma gas flow meter 10 ~ 100 L / h Auxillary gas flow meter 10 ~ 100 L / h Carrier gas flow meter 5 liters per min Cooling water flow rate 21 ~ 26 0C Cooling water temperature Ø 10 mm Water outlet diameter 0.26 nm Line dispersion rate ≤ 0.008 nm Resolving power 20 µm Incident slit 6 mm Co-axial sprayer diameter 25 mm ( 3 turn ) Coil diameter 34 mm Double room fog diameter 20 mm Quartz tube torch diameter 78 x 105 x 16 mm Mirror dimensions
Element Detection Limits (Unit - µg / ml) Element Mg Ca Sr Ba Sc Y Eu Yb Be Wavelength ( nm ) 279.553 393.366 407.771 455.403 335.373 371.030 381.967 369.419 313.042 Detection limit < 1.0 < 1.0 < 1.0 < 1.0 < 1.0 < 1.0 < 1.0 < 1.0 < 1.0 Element La Gd Dy Ho Lu Er Tm Zn Cd Wavelength ( nm ) 333.749 342.247 353.170 261.542 345.600 337.271 313.126 213.856 226.502 Detection limit < 3.0 < 3.0 < 3.0 < 1.0 < 3.0 < 3.0 < 3.0 < 3.0 < 3.0 Element Ti Cu Mn V B Ni Cr Co Fe Wavelength ( nm ) 344.941 324.754 257.610 309.311 249.773 221.647 205.552 238.204 239.562 Detection limit < 3.0 < 3.0 < 3.0 < 3.0 < 5.0 < 5.0 < 5.0 < 5.0 < 3.0 Element Mo Zr Ag Au Si Al Ir P Hg Wavelength ( nm ) 343.823 202.030 328.068 242.795 251.611 396.152 224.268 213.618 194.227 Detection limit < 5.0 < 5.0 < 5.0 < 5.0 < 5.0 < 10.0 < 10.0 < 10.0 < 10.0