Download
1 / 24
250 likes | 415 Views
Section 8.3 Testing a claim about a Proportion. Objective For a population with proportion p , use a sample (with a sample proportion) to test a claim about the proportion. Testing a proportion uses the standard normal distribution ( z -distribution). Notation.

E N D
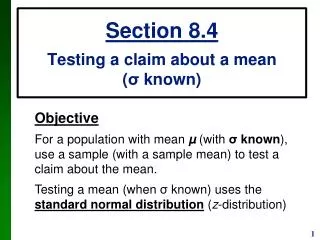
Section 8.3Testing a claim about a Proportion Objective For a population with proportion p, use a sample (with a sample proportion) to test a claim about the proportion. Testing a proportion uses the standard normal distribution(z-distribution)
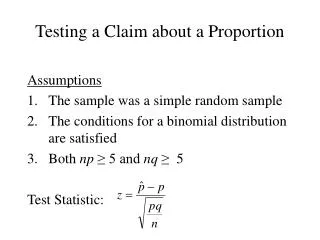
(1) The sample used is a a simple random sample(i.e. selected at random, no biases) (2) Satisfies conditions for a Binomial distribution np0 ≥ 5 and nq0 ≥ 5 Requirements Note: 2 and 3 satisfy conditions for the normal approximation to the binomial distribution Note: p0is the assumed proportion, not the sample proportion
Test Statistic Denoted z (as in z-score) since the test uses the z-distribution.
Traditional method: If the test statistic falls within the critical region, reject H0. If the test statistic does not fall within the critical region, fail to reject H0 (i.e. accept H0).
Types of Hypothesis Tests:Two-tailed, Left-tailed, Right-tailed The tails in a distribution are the extreme regions where values of the test statistic agree with the alternative hypothesis
H0: p = 0.5 H1: p < 0.5 Left-tailed Test “<” significance level Area = -z (Negative)
H0: p = 0.5 H1: p > 0.5 Right-tailed Test “>” significance level Area = z (Positive)
H0: p = 0.5 H1: p ≠ 0.5 Two-tailed Test “≠” significance level Area = /2 Area = /2 -z/2 z/2
Example 1 The XSORT method of gender selection is believed to increases the likelihood of birthing a girl. 14 couples used the XSORT method and resulted in the birth of 13 girls and 1 boy. Using a 0.05 significance level, test the claim that the XSORT method increases the birth rate of girls. (Assume the normal birthrate of girls is 0.5) What we know: p0= 0.5 n= 14 x = 13 p = 0.9286 Claim: p > 0.5 using α= 0.05 np0= 14*0.5 = 7 nq0= 14*0.5 = 7 Since np0 >5 and nq0 >5, we can perform a hypothesis test.
Example 1 What we know: p0= 0.5 n= 14 x = 13 p = 0.9286 Claim: p > 0.5 using α= 0.01 H0:p = 0.5 H1:p> 0.5 Right-tailed Test statistic: zα = 1.645 z = 3.207 Critical value: z in critical region Initial Conclusion:Since z is in the critical region, reject H0 Final Conclusion: We Accept the claim that the XSORT method increases the birth rate of girls
P-Value The P-value is the probability of getting a value of the test statistic that is at least as extremeas the one representing the sample data, assuming that the null hypothesis is true. Example p-value (area) z Test statistic zαCritical value P-value = P(Z > z) z zα
P-Value Critical region in the right tail: P-value = area to the rightof the test statistic Critical region in the left tail: P-value = area to the leftof the test statistic P-value = twice the area in the tail beyond the test statistic Critical region in two tails:
P-Value method: If P-value ,reject H0. If P-value > , fail to reject H0. If the P is low, the null must go. If the P is high, the null will fly.
Caution P-value = probability of getting a test statistic at least as extreme as the one representing sample data p= population proportion Don’t confuse a P-value with a proportion p. Know this distinction:
Calculating P-value for a Proportion Stat → Proportions → One sample → with summary
Calculating P-value for a Proportion Enter the number of successes (x) and the number of observations (n)
Calculating P-value for a Proportion Enter the Null proportion (p0) and select the alternative hypothesis (≠, <, or >) Then hit Calculate
Calculating P-value for a Proportion The resulting table shows both the test statistic (z) and the P-value P-value Test statistic P-value = 0.0007
Using P-value Example 1 What we know: p0= 0.5 n= 14 x = 13 p = 0.9286 Claim: p > 0.5 using α= 0.01 H0:p = 0.5 H1:p> 0.5 Stat → Proportions→ One sample → With summary ● Hypothesis Test Number of successes: Number of observations: 13 14 0.5 > Null: proportion= Alternative P-value = 0.0007 Initial Conclusion:Since p-value < α (α = 0.05), reject H0 Final Conclusion: We Accept the claim that the XSORT method increases the birth rate of girls
A statistical test cannot definitely provea hypothesis or a claim. Our conclusion can be only stated like this: The available evidence is not strong enough to warrant rejection of a hypothesis or a claim We can say we are 95% confident it holds. Do we prove a claim? “The only definite is that there are no definites” -Unknown
Example 2 Problem 32, pg 424 Mendel’s Genetics Experiments When Gregor Mendel conducted his famous hybridization experiments with peas, one such experiment resulted in 580 offspring peas, with 26.2% of them having yellow pods. According to Mendel’s theory, ¼ of the offspring peas should have yellow pods. Use a 0.05 significance level to test the claim that the proportion of peas with yellow pods is equal to ¼. What we know: p0= 0.25 n= 580 p = 0.262 Claim: p= 0.25 using α= 0.05 np0= 580*0.25 = 145 nq0= 580*0.75 = 435 Since np0 >5 and nq0 >5, we can perform a hypothesis test.
Example 2 What we know: p0= 0.25 n= 580 p = 0.262 Claim: p= 0.25 using α= 0.05 H0:p = 0.25 H1:p ≠ 0.25 Two-tailed Test statistic: zα = 1.960 zα = -1.960 z = 0.667 Critical value: znot in critical region Initial Conclusion:Since z is not in the critical region, accept H0 Final Conclusion: We Accept the claim that the proportion of peas with yellow pods is equal to ¼
Using P-value Example 2 What we know: p0= 0.25 n= 580 p = 0.262 Claim: p= 0.25 using α= 0.05 Stat → Proportions→ One sample → With summary H0:p = 0.25 H1:p ≠ 0.25 ● Hypothesis Test Number of successes: Number of observations: 152 580 0.25 ≠ Null: proportion= Alternative x = np= 580*0.262 ≈ 152 P-value = 0.5021 Initial Conclusion:Since P-value > α, accept H0 Final Conclusion: We Accept the claim that the proportion of peas with yellow pods is equal to ¼