Download
1 / 26
270 likes | 455 Views
Ports and the Economy. Presentation for Management Seminar Unisantos, Brazil by Dr. Veronica Z. Kalich Associate Professor – Economics Baldwin-Wallace College May 2005. Global Patterns of US Merchandise Trade - Balance. 2004 Balance of TOTAL in thousands $USD .

E N D
Ports and the Economy Presentation for Management Seminar Unisantos, Brazil by Dr. Veronica Z. Kalich Associate Professor – Economics Baldwin-Wallace College May 2005
Global Patterns of US Merchandise Trade - Balance 2004 Balance of TOTAL in thousands $USD
U.S. Merchandise Trade Balance With the World in 2004 by Specific Products http://tse.export.gov/NTDChartDisplay.aspx?UniqueURL=b02fabe11gh5htzoey4yrerh-2005-5-4-10-51-44
U.S. Trade Deficit and the Trade Weighted Index of the U.S. Dollar (1973 = 100)
U.S. Trade Deficit and Change in Currency Valuation (1980-2004)
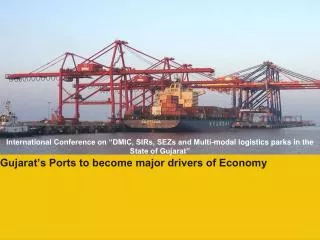
Ports as Gateways to Global Trade Black Falcon Cruise TerminalBoston, MA Military CargoPort of Tacoma, WA Salt transferred atPort Newark/Elizabeth, NJ Hanjin Shipping TerminalPort of Long Beach, CA Virginia Port Authority, VA Wood pulp LoadingAlabama State DocksMobile, AL Florida Dept. of Commerce
Economic Impact of Ports • Port Industry accounts for 4 million jobs • Port-related jobs generate $44 billion in Personal Income, annually • Port-related incomes supply federal and local government $16.1 billion in total tax revenues • Port activity accounts for $723 billion annually to GDP Source 1
Selected World Port RankingTotal Cargo Volume 2003 ~ * MT = Metric Ton FT = Freight Ton
Role of Ports in Economic Development • Ports are a major determinant of industrial plant location • Waterfront sites provide low-cost transportation of finished goods and raw materials • Continued U.S. economic growth will fuel demand for imports • Port capacity is not expected to keep up with the growing activity • Underinvestment in port and intermodal infrastructure
Ships Benefit Ohio's Environment • Waterborne commerce is the greenest form of transportation. • Ships burn less fuel and produce fewer emissions than trains or trucks • Typical season, ships use 9.6 million gallons of fuel to deliver roughly 8 million tons of iron ore to Lorain • Were that trade to switch to trains, locomotives would burn more than 14 million gallons of fuel and their emissions would double that of ships
Port Congestion – Infrastructure Problem • Ports can’t expand (ie. California) • Infrastructure costs are beyond the state’s fiscal capacity/resources • Anti-expansion sentiments • Ports come with traffic problems and pollution • Rising Fuel costs affect truckers hauling loads • “waiting isn’t worthwhile” • Few legislative responses • Focus is more on increased security • Use of alternative deep-water ports
U.S. Waterborne Foreign TradeTop 10 Trading PartnersContainerized Cargo2004 *Twenty-Foot Equivalent Units Source 3
Top 10 U.S. Ports Ranked by Value of Cargo Foreign Trade (2003 - $Mils.U.S.) Source 2
Port and Intermodal Chokepoints Problem Spots - 2004
Forecast • Underinvestment in port and intermodal infrastructure • By 2020, its predicted that the U.S. transportation system will handle cargo valued at more than $28 trillion • Continued U.S. economic growth will fuel demand for imports • Port capacity is not expected to keep up with the growing activity Source 3
Forecast • China’s economy (GDP) expected to double by 2010 • Restrictive labor practices in the US will hinder productivity growth at the ports • Chokepoints between the ports and inland transportation will stall transfer of cargo • Without a coherent expansion plan for transportation INFRASTUCTURE PROBLEMS will continue Source 3
Possible Solutions • Financing Improvements • Improve rail and highway (inland modes of transportation) • U.S. public ports have already made advances • Expected investment: $1 billion each future year • Public/Private Partnerships • Involving all stakeholders • Carriers, ports, truckers • railroads • Government (state, local and Federal) • Insourcing manufacturing – in North America • Train more workers Source 1