Download
1 / 17
170 likes | 261 Views
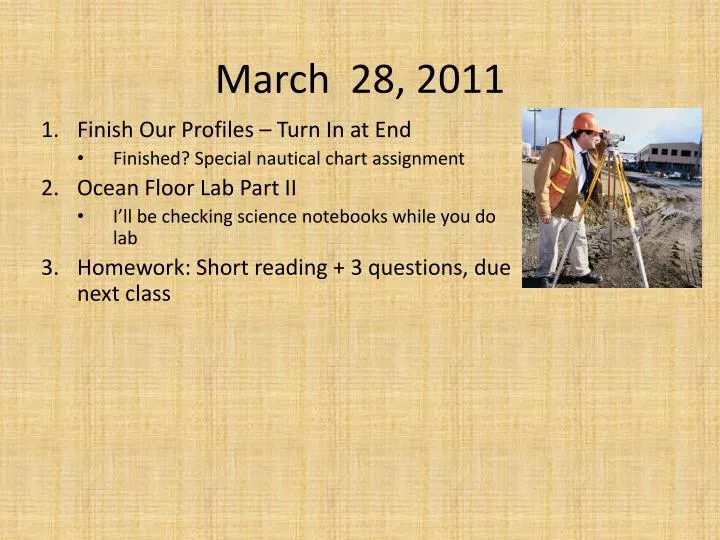
Finish Our Profiles – Turn In at End Finished? Special nautical chart assignment Ocean Floor Lab Part II I’ll be checking science notebooks while you do lab Homework: Short reading + 3 questions, due next class. March 28, 2011. Profiles. Very good in general; we’re almost done

E N D
Finish Our Profiles – Turn In at End • Finished? Special nautical chart assignment • Ocean Floor Lab Part II • I’ll be checking science notebooks while you do lab • Homework: Short reading + 3 questions, due next class March 28, 2011
Profiles • Very good in general; we’re almost done • There were some things I didn’t explain well: • In general, use same scale on both axes if you want your profile to look “real” – okay this time • I should have added a “cumulative” column to your data sheets to make graphing easier • Make sure to use the same units • Remember that your graph is a “profile” or “cross section” of the path you walked
“Cumulative” Column Insert columns Then you can read off the (x,y) pairs to graph: (0,0) (8.7, 5.1) (18.8, 10.35) (39.3, 15.45) etc.
Questions to Answer • What was the average slope of your profile? • How does your average slope (answer to #1) compare with the average slopes of seafloor features shown below? 0.115° 5-25° 30-45° 0.34° 0° 10-15° 5°
Use a Fine Felt Pen to Mark 15 cm of Skewer (“Depth Sounder”)
Choose Approximately 10 Transects (Lines) to Investigate 10 Lines
Carefully Punch Holes in the Middle of MOST (not all) of the Squares Along Each Line (Transect)
Measure the “Water Depth” and Record the Depth Next to the Hole 15 cm is the top of my skewer 4.5 cm leftover Therefore water depth = 15 – 4.5 = 10.5 cm
Record the depth as a Point 10.5 cm
Connect the Points Ocean Surface 10.5 cm Ocean Floor
Repeat for all Transects (Lines) • Punch Holes • Sound Depth • Record Depth on Box Lid (ocean surface) • Fold Graph Paper and Label Which Line it is • Mark the Depths on the Graph Paper • Connect the Points • Cut Out Seafloor Shape