Download
1 / 33
330 likes | 436 Views
Possible use of Copernicus MACC-II modeling products in EEAs assessment work. Leonor Tarrasón , Jan Horálek, Laure Malherbe, Philipp Schneider, Anthony Ung , Bruce Denby, Linton Corbet and Peter de Smet 18tn EIONET workshop on Air Quality Assessment and Management

E N D
Possibleuse of Copernicus MACC-II modelingproducts in EEAsassessmentwork Leonor Tarrasón, Jan Horálek, Laure Malherbe, Philipp Schneider, Anthony Ung, Bruce Denby, Linton Corbet and Peter de Smet 18tn EIONET workshop on Air Quality Assessment and Management Dublin, Ireland, 24th and 25th October 2013
Outline Mappingassessments at EEA Use of MACC-II ensemble products Results for PM10 and O3 The role of spatial resolution Conclusions and recommendations
Outline Mappingassessments at EEA Use of MACC-II ensemble products Results for PM10 and O3 The role of spatial resolution Conclusions and recommendations
Approaches to AQ assessments Three differentapproaches to air quality status assessments: Mappingbasedon air qualityobservations Mappingbasedon air qualitymodelling Mappingbasedon a combination of models and measurements Increasingaccuracy in thedescription of theextent of exceedances in a certain area
Whymapping? Support to nationalassessments • PM2.5 source contribution in Oslo
Mapping for regulatory purposes Differentmappingapproaches in differentcountries The recent ETC/ACM reportcontains an overview of situationontheuse of models for regulatory purposes in 2010 and European compositemaps http://acm.eionet.europa.eu/reports/docs/ETCACM_TP_2013_3_CompAQModMaps_v2.pdf
CurrentMapping at ETC/ACM • Unified methodology to estimate background concentrations in Europe in 10x10 km2 • Useful for population exposure analysis • Includes an analysis of uncertainties and probability of exceedance of limit values
EEAscurrentmappingmethodology • Airbase background rural and urban stations • EMEP model calculation in 50x50km2 • Meteorological and site parameters • Residual kriging for rural and urban maps • Merging Rural and Urban kriging results • PM10, O3 annual averages • PM10 36st highest daily average • O3 26th highest daily max 8-h avg • SOMO35, AOT40 Combined rural and urban concentration map.
PM10 – 36th maximum daily average values, year 2009 Resolution: 10x10 km. Probability of exceedance of limit value based on standard interpolation error.
Outline Mappingassessments at EEA Use of MACC-II ensemble products Results for PM10 and O3 The role of spatial resolution Conclusions and recommendations
Possible improvements of background mapping: example for NO2 1. Airbase station data 2. Ordinary kriging of Airbase station data 3. Residual kriging of Airbase station data using OMI satellite obs. • OMI NO2 satellite data from • NASA Godard GESC DISC • 2012 ETC/ACM Task 1.0.2.8
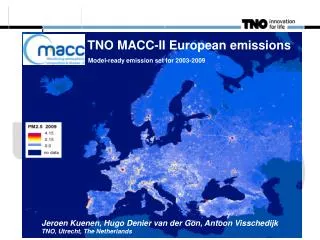
Possible improvements through use of Copernicus MACC-II products • MACC –II ensemble • Operationalproductswith 25x25 km2 and 10x10 km2 • http://macc-raq.gmes-atmosphere.eu/som_ensemble.php
Indicatormapsevaluated Rural and urban backgroundmaps For years 2009 and 2010
Outline Mappingassessments at EEA Use of MACC-II ensemble products Results for PM10 and O3 The role of spatial resolution Conclusions and recommendations
Evaluation of EEA mappingresultswithuse of differentbackgroundmodels Identification of meaningfulcomparisons from available data, avoiding data assimilationissues 2009 Residual kriging using EMEP modelbackground (50x50 km2) Residual kriging using EC4MACS hindcast (50x50 km2) Residualkriging using MACC-II ensemble hindcast (25x25km2) Residualkriging using EC4MACS hindcast (7x7 km2) 2010 Residual kriging using EMEP modelbackground (50x50 km2) Residual kriging using MACC-II ensemble hindcast (10x10km2) … and allowing for an evaluation of theeffect of scale
ETC/ACM residual krigingEvaluation of CTM models used Similarmappingresultsbothfor O3 and PM10 indicators, withdifferentbackgroundmodel used MACCens hindcast EMEP
Kriging driven by observations URBAN RURAL • MACC_ens_hindcast EMEP • Largerdifferencesbetween rural and urban krigedmapsindependently of themodels used
PM10 - rural areas -2009 Significantimprovement in performace inherent to residual kriging as themethod is developped to optimize RMSE
PM10- urban background - 2009 • Significantimprovement in performace inherent to residual kriging as themethod is developped to optimize RMSE
modelvs DA vskriged • Largestdifferences in areas withfewobservations, • kriging driven by observations
Is residual kriging betterthan DA ? Not really, therearecaveats in thecomparison MACC-II DA does not usethe same stations Caveats in the present comparison !!!
Not all stationsare in MACC-II data DA but all areincluded in ETC/ACM kriging
Outline Mappingassessments at EEA Use of MACC-II ensemble products Results for PM10 and O3 The role of spatial resolution Conclusions and recommendations
SOMO35 –rural 2009 25x25 km2 7x7 km2 50x50 km2
SOMO35 –urban background2009 50x50 km2 7x7 km2 25x25 km2
PM10 – rural areas -2010 MACC-II ensemble in 2010 with 10x10 km2 Improvementwith MACC-II ensemble Both in rural and urban areas Effect of increasedresolution
PM10 general performance Finer resolutionimprovestheresults MACC generallybetterresults for PM10 in 2010 because of incresedresolution
Ozone general performance MACC general betterperformance, specially in 2010 with finer resolution
Conclusions • Residual kriging results largely driven by observations • Therefore there are larger differences in the urban vs rural maps than between models used • and differences between mapping results are larger where we have fewer stations! • Similar mapping results independently of the models used although in the analysed cases the MACC-II ensemble shows general better performance • MACC-II ensemble appears to be better when used in 10 x 10 km2, specially for urban background mapping
Recommendations ETC/ACM mappingactivitieswillbenefit from theregularuse of MACC-II ensemble productsboth for rural and urban backgroundassessments MACC-II ensemble has long-termsustainability, can be availableregularly (yearlyassessments) and canprovideaccuratemodelresultswithincreased spatial resolution. However, thecapabilities of MACC-II ensemble data assimilationresults have not beenassessed in thiscontext. It is recommended to carryout a dedicatedstudy of thecapabilities of the DA data assimilatedproducts from MACC-II ensemble in comparisonwithEEAs urban and rural backgroundassessmentmappingroutines.