Download
1 / 1
10 likes | 161 Views
Oxidation Study of Transition Metals Coleman Sperando , Shelby McCrackin, Minseong Lee, Dr. Maitri Warusawithana Department of Physics, Florida State University, Tallahassee, FL, 32310 National High Field Magnetic Laboratory, Tallahassee, FL, 32310. Abstract

E N D
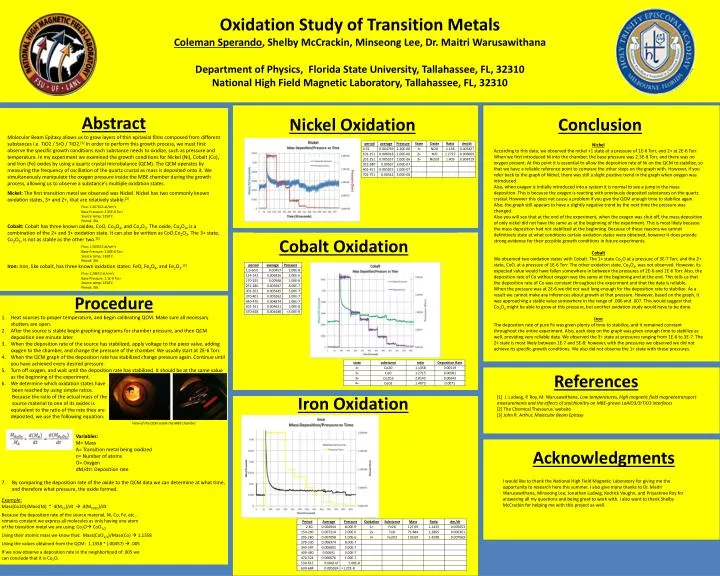
Oxidation Study of Transition Metals Coleman Sperando, Shelby McCrackin, Minseong Lee, Dr. Maitri Warusawithana Department of Physics, Florida State University, Tallahassee, FL, 32310National High Field Magnetic Laboratory, Tallahassee, FL, 32310 Abstract Molecular Beam Epitaxy allows us to grow layers of thin epitaxial films composed from different substances i.e. TiO2 / SrO / TiO2.[1] In order to perform this growth process, we must first observe the specific growth conditions each substance needs to oxidize, such as pressure and temperature. In my experiment we examined the growth conditions for Nickel (Ni), Cobalt (Co), and Iron (Fe) oxides by using a quartz crystal microbalance (QCM). The QCM operates by measuring the frequency of oscillation of the quartz crustal as mass is deposited onto it. We simultaneously manipulate the oxygen pressure inside the MBE chamber during the growth process, allowing us to observe a substance’s multiple oxidation states. Nickel: The first transition metal we observed was Nickel. Nickel has two commonly known oxidation states, 3+ and 2+, that are relatively stable.[2]Flux: 1.367E13 at/cm2s Base Pressure: 2.35E-8 Torr Source temp: 1250 ̊C Period: 30s Cobalt: Cobalt has three known oxides, CoO, Co3O4, and Co2O3. The oxide, Co3O4, is a combination of the 2+ and 3+ oxidation state. It can also be written as CoO.Co2O3. The 3+ state, Co2O3, is not as stable as the other two.[2]Flux: 1.305E13 at/cm2s Base Pressure: 1.09E-8 Torr Source temp: 1320 ̊C Period: 30s Iron: Iron, like cobalt, has three known oxidation states: FeO, Fe3O4, and Fe2O3.[2]Flux: 1.28E13 at/cm2s Base Pressure: 1.1E-9 Torr Source temp: 1250 ̊C Period: 30s Nickel Oxidation Conclusion Nickel According to this data, we observed the nickel +1 state at a pressure of 1E-6 Torr, and 2+ at 2E-6 Torr. When we first introduced Ni into the chamber, the base pressure was 2.3E-8 Torr, and there was no oxygen present. At this point it is essential to allow the deposition rate of Ni on the QCM to stabilize, so that we have a reliable reference point to compare the other steps on the graph with. However, if you refer back to the graph of Nickel, there was still a slight positive trend in the graph when oxygen was introduced. Also, when oxygen is initially introduced into a system it is normal to see a jump in the mass deposition. This is because the oxygen is reacting with previously deposited substances on the quartz crystal. However this does not cause a problem if you give the QCM enough time to stabilize again. Also, the graph still appears to have a slightly negative trend by the next time the pressure was changed.Also you will see that at the end of the experiment, when the oxygen was shut off, the mass deposition of only nickel did not have the same as at the beginning of the experiment. This is most likely because the mass deposition had not stabilized at the beginning. Because of these reasons we cannot definitively state at what conditions certain oxidation states were obtained, however it does provide strong evidence for their possible growth conditions in future experiments. Cobalt We observed two oxidation states with Cobalt. The 1+ state Co2O at a pressure of 3E-7 Torr, and the 2+ state, CoO, at a pressure of 1E-6 Torr. The other oxidation state, Co3O4, was not observed. However, its expected value would have fallen somewhere in between the pressures of 2E-6 and 1E-6 Torr. Also, the deposition rate of Co without oxygen was the same at the beginning and at the end. This tells us that the deposition rate of Co was constant throughout the experiment and that the data is reliable. When the pressure was at 2E-6 we did not wait long enough for the deposition rate to stabilize. As a result we cannot make any inferences about growth at that pressure. However, based on the graph, it was approaching a stable value somewhere in the range of .006 and .007. This would suggest that Co3O4 might be able to grow at this pressure, but another oxidation study would have to be done. Iron The deposition rate of pure Fe was given plenty of time to stabilize, and it remained constant throughout the entire experiment. Also, each step on the graph was given enough time to stabilize as well, providing very reliable data. We observed the 3+ state at pressures ranging from 1E-6 to 3E-7. The 2+ state is most likely between 1E-7 and 5E-8: however, with the pressures we observed we did not achieve its specific growth conditions. We also did not observe the 1+ state with these pressures. Cobalt Oxidation • Procedure • Heat sources to proper temperature, and begin calibrating QCM. Make sure all necessary shutters are open. • After the source is stable begin graphing programs for chamber pressure, and then QCM deposition one minute later. • When the deposition rate of the source has stabilized, apply voltage to the piezo valve, adding oxygen to the chamber, and change the pressure of the chamber. We usually start at 2E-6 Torr. • When the QCM graph of the deposition rate has stabilized change pressure again. Continue until you have achieved every desired pressure. • Turn off oxygen, and wait until the deposition rate has stabilized. It should be at the same value as the beginning of the experiment. • We determine which oxidation states have been reached by using simple ratios. Because the ratio of the actual mass of the source material to one of its oxides is equivalent to the ratio of the rate they are deposited, we use the following equation: • Variables:M= MassA= Transition metal being oxidizedn= Number of atomsO= OxygendM/dt= Deposition rate • 7. By comparing the deposition rate of the oxide to the QCM data we can determine at what time, and therefore what pressure, the oxide formed. • Example:Mass(Co2O)/Mass(Ni) * d(MCo)/dt d(MC02O)/dt • Because the deposition rate of the source material, Ni, Co, Fe, etc… remains constant we express all molecules as only having one atom of the transition metal we are using: Co2O CoO1/2 • Using their atomic mass we know that: Mass(CoO1/2)/Mass(Co) 1.1358 • Using the values obtained from the QCM: 1.1358 * (.00457) .005 • If we now observe a deposition rate in the neighborhood of .005 we can conclude that it is Co2O. References Iron Oxidation [1] J. Ludwig, P. Roy, M. Warusawithana, Low temperatures, high magnetic field magnetotransport measurements and the effects of stoichionitry on MBE-grown LaAlO3/SrTiO3 interfaces [2] The Chemical Thesaurus. website [3] John R. Arthur, Molecular Beam Epitaxy View of the QCM inside the MBE chamber Acknowledgments I would like to thank the National High Field Magnetic Laboratory for giving me the opportunity to research here this summer. I also give many thanks to Dr. Maitri Warusawithana, Minseong Lee, Jonathan Ludwig, Kedrick Vaughn, and Priyashree Roy for answering all my questions and being great to work with. I also want to thank Shelby McCrackin for helping me with this project as well.