Download
1 / 17
180 likes | 575 Views
Markov Chains in Baseball. Joe Guilfoyle Probability. Markov Chains Explained. A Markov analysis looks at a sequence of events, and analyzes the tendency of one event to be followed by another.

E N D
Markov Chains in Baseball Joe Guilfoyle Probability
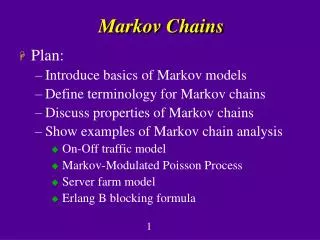
Markov Chains Explained • A Markov analysis looks at a sequence of events, and analyzes the tendency of one event to be followed by another. • Markov Chains are useful for analyzing random events that are dependent on only the previous event • Not useful for independent events such as coin flips • The "output chain" statistically reflects the transition probabilities from one state to the next.
Markov Illustration http://www.doctornerve.org/nerve/pages/interact/mrkvform.shtml Input: “the boy and the dog went to the park.” There is a 33.3% chance that either “boy”, “dog”, or “park” will follow “the” in the output. The phrase “boy went” will never occur in the output because it never occurred in the input.
Applications of Markov Chains Physics Chemistry Social Sciences Economics Music Board Games And of course…
Baseball! A baseball game is a set of transitions, each initiated by plate appearances
Method • There are 25 possible game situations • 8 distributions of base runners: a player either is or is not on each base (23 = 8) • There are either zero, one, or two outs for each base runner scenario (3*8 = 24) • The final state, where there are 3 outs, is called the absorbing state • A state is called absorbing if it is impossible to transition out of this state.
Method Figure 1 Figure 2
Method • A : do not increase the number of outs • B : increase the number of outs by 1 but do not end with 3 outs • C : increase the number of out from 0 to 2 • D : vector probability from 0 to 3 outs • E : vector probability from 1 to 3 outs • F vector probability from 2 to 3 outs • 0: represent transitions that decrease the number of outs
Method First 8 columns represent transition states with 0 outs Second 8 columns represent transition states with 1 out Third 8 columns represent transition states with 2 outs Final column represents transitions to the absorbing 3 outs state Rows represent transition probabilities from these respective states
Example • Consider “Batter A” who only hits singles and has a batting average of .300 • At the start of the inning there are 0 outs and 0 runners on base • There are two possible end states • (1 on first, 0 outs) with a probability of 0.3 • (0 on base, 1 out) with a probability of 0.7 • Let’s consider end state 1.
Example • Now suppose “Batter B” (who also only hits singles) comes to the plate… • Batter makes an out and runner stays where he is • Batter makes an out and runner advances • Batter makes a hit and runner advances to second • Batter makes a hit and runner advances to third • Batter grounds in to a double play
Example Using Batter B’s batting average, we can work out the probabilities of each end state This process is repeated for all start and end states http://www.tangotiger.net/markov.html
Runs Scored • One goal of using Markov chains to predict and then maximize the number of runs scored. • Certain transitions result in runs • E.g. A transition from the state (12,0) to (2,0) in a single at-bat requires that two runners score.
Batting Order • Adjustments to the batting order • Particular batting orders are optimal for scoring the maximum number of runs • Typically, your best batter is 2nd, 3rd, or 4th in the lineup with your other top batters filling in the other beginning lineup spots. • Worse batters should be placed towards the back of the lineup
Batting Order Further analysis of run scoring can provide an optimal lineup of the 9! possibilities Intuitively, first innings have the most number of runs scored and second innings have the least Variation in the number of runs per inning decreases as the game goes on
Trades • The Markov chain method can be used to calculated the expected increase or decrease of team wins as the result of a trade • In 1989, the Mets finished 2nd in their division and the Cardinals finished 3rd • A trade was simulated between Milt Thompson of the Cardinals, a good singles hitter, and Darryl Strawberry of the Mets, a good slugger. • Using the Markov chain method, this trade was shown to increase the Cardinals’ runs by 11 for the season and wins by 1.5 • Meanwhile the Mets would have had 13 fewer runs and would have lost 1.7 more games • This would have moved the Cardinals to first and the Mets to third.
Sources http://archive.ite.journal.informs.org/Vol5No1/Sokol/Sokol.pdf http://m.njit.edu/~bukiet/Papers/ball.pdf http://www.doctornerve.org/nerve/pages/interact/markhelp.htm http://www.hardballtimes.com/main/article/introducing-markov-chains/ http://www.pankin.com/markov/theory.htm