Download
1 / 70
740 likes | 1.05k Views
Topic 6 Clustering and Unsupervised Learning. credits: Padhraic Smyth lecture notes Hand, et al Chapter 9 David Madigan lecture notes. Clustering Outline. Introduction to Clustering Distance measures k-means clustering hierarchical clustering probabilistic clustering. Clustering.

E N D
Topic 6Clustering and Unsupervised Learning credits: Padhraic Smyth lecture notes Hand, et al Chapter 9 David Madigan lecture notes Data Mining - Volinsky - 2011 - Columbia University
Clustering Outline • Introduction to Clustering • Distance measures • k-means clustering • hierarchical clustering • probabilistic clustering Data Mining - Volinsky - 2011 - Columbia University
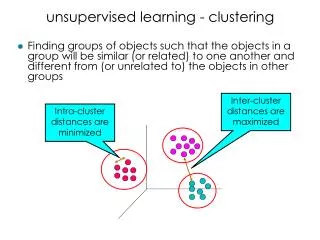
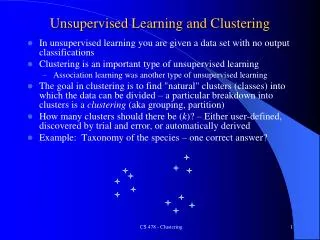
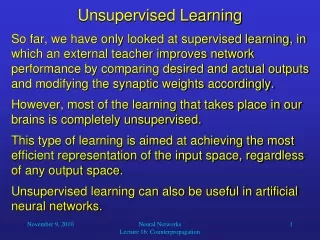
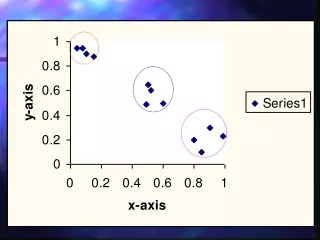
Clustering • “automated detection of group structure in data” • Typically: partition N data points into K groups (clusters) such that the points in each group are more similar to each other than to points in other groups • descriptive technique (contrast with predictive) • Identify “natural” groups of data objects - qualitatively describe groups of the data • often useful, if a bit reductionist • for real-valued vectors, clusters can be thought of as clouds of points in p-dimensional space • Also called unsupervised learning Data Mining - Volinsky - 2011 - Columbia University
Clustering Data Mining - Volinsky - 2011 - Columbia University
What is Cluster Analysis? • A good cluster analysis results in • Similar (close) to one another within the same cluster • Dissimilar (far) from the objects in other clusters • In other words • high intra-cluster similarity (low intra-cluster variance) • low inter-cluster similarity (high inter-cluster variance) Data Mining - Volinsky - 2011 - Columbia University
Example Data Mining - Volinsky - 2011 - Columbia University
Example Data Mining - Volinsky - 2011 - Columbia University
Why is Clustering useful? • “Discovery” of new knowledge from data • Contrast with supervised classification (where labels are known) • Can be very useful for summarizing large data sets • For large n and/or high dimensionality • Applications of clustering • WWW • Clustering of documents produced by a search engine (google news) • Customer Segmentation • Spatial data Analysis • geographical clusters of events: cancer rates, sales, etc. • Clustering of genes with similar expression profiles • many more Data Mining - Volinsky - 2011 - Columbia University
General Issues in Clustering • No golden truth! • answer is often subjective • Cluster Representation: • What types or “shapes” of clusters are we looking for? What defines a cluster? • Other issues • Distance function, D[x(i),x(j)] critical aspect of clustering, both • distance of individual pairs of objects • distance of individual objects from clusters • How is K selected? Data Mining - Volinsky - 2011 - Columbia University
Clustering Outline • Introduction to Clustering • Distance measures • k-means clustering • hierarchical clustering • probabalistic clustering Data Mining - Volinsky - 2011 - Columbia University
Distance Measures • In order to cluster, we need some kind of “distance” between points. • Sometimes distances are not obvious, but we can create them Data Mining - Volinsky - 2011 - Columbia University
Some Distances • Euclidean distance (L2): d(x,y) = • The most common notion of “distance.” • Manhattan distance (L1) • distance if you had to travel along coordinates only. Data Mining - Volinsky - 2011 - Columbia University
Examples of Euclidean Distances y = (9,8) L2: dist(x,y) = (42+32) = 5 5 3 L1: dist(x,y) = 4+3 = 7 4 x = (5,5) Data Mining - Volinsky - 2011 - Columbia University
Non-Euclidean Distances • Some observations are not appropriate for Euclidian distance: • Binary Vectors: 10011 vs. 11000 • Strings: “Statistics” vs. “sadistics” • Ordinal variables: “M.S” vs. “B.A.” • Categorical: blue vs. green How to calculate distances for variables like these? Data Mining - Volinsky - 2011 - Columbia University
Distances for Binary Vectors • A=101110; B=100111 • Hamming distance: # of changes to get from A to B • Hamming(A,B) = 2 • Can be normalized by length of string: 2/6 • Jaccard Similarity: intersection over union • Intersection: # of 1s in common =3 • Union: # of spaces with at least one 1 = 5 • Jaccard similarity = 3/4. • Jaccard distance = 1-3/4 = ¼ • Both of these are metrics => satisfy triangle inequality Data Mining - Volinsky - 2011 - Columbia University
Cosine Distance (similarity) • Think of a point as a vector from the origin (0,0,…,0) to its location. • Two points’ vectors make an angle, the cosine of this angle is a measure of similarity • Recall cos(0) = 1; cos(90)=0 • Also: the cosine is the normalized dot-product of the vectors: • Example p1 = 00111; p2 = 10011. • cos() = 2/3; is about 48 degrees. Data Mining - Volinsky - 2011 - Columbia University
Cosine-Measure Diagram p1 p2 p1.p2 ||p2|| Data Mining - Volinsky - 2011 - Columbia University
Edit Distance for strings • Hamming distance for strings: the number of inserts and deletes of characters needed to turn one into the other. • Equivalently: d(x,y) = |x| + |y| - 2|LCS(x,y)|. • LCS = longest common subsequence = longest string obtained both by deleting from x and deleting from y. Data Mining - Volinsky - 2011 - Columbia University
Example • x = statistics; y = sadistic. • Turn x into y by deleting t, deleting t, then inserting d, and deleting s. • Edit-distance = 4. • Or, LCS(x,y) = saistic. • |x| + |y| - 2|LCS(x,y)| = 10+8-14=4. Data Mining - Volinsky - 2011 - Columbia University
Categorical Variables • A generalization of the binary variable in that it can take more than 2 states, e.g., red, yellow, blue, green • Method 1: Simple matching • m: # of matches, p: total # of variables • Distance(Alice,Craig) = 4-3/4 = 1/4 Data Mining - Volinsky - 2011 - Columbia University
Ordinal Variables • An ordinal variable can be discrete or continuous • order is important, e.g., rank • Pretend they are interval scaled • replacing xif by their rank • map the range of each variable onto [0, 1]: • compute the dissimilarity using methods using Euclidean or other distance Data Mining - Volinsky - 2011 - Columbia University
Clustering Methods • enough about distances! • Now we have a matrix (n x n) of distances. • Two major types of clustering algorithms: • partitioning • Partitions the set into clusters with defined boundaries • place each point in its nearest cluster • hierarchical • agglomerative: each point is in its own cluser, iteratively combine • divisive: all data in one cluser, iteratively dissect Data Mining - Volinsky - 2011 - Columbia University
Clustering Outline • Introduction to Clustering • Distance measures • k-means Clustering • Hierarchical clustering • Probabalistic clustering Data Mining - Volinsky - 2011 - Columbia University
k –Means Algorithm(s) • Assumes Euclidean space. • Start by picking k, the number of clusters. • Initialize clusters by picking one point per cluster. • typically, k random points Data Mining - Volinsky - 2011 - Columbia University
K-Means Algorithm • Arbitrarily select K objects from the data (e.g., K customer) to be each a cluster center • For each of the remaining objects: Assign each object to the cluster whose center it is most close to Cluster center Cluster center Data Mining - Volinsky - 2011 - Columbia University
K-Means Algorithm Then Repeat the following 3 steps until clusters converge (no change in clusters): • Compute the new center of the current clusters. Data Mining - Volinsky - 2011 - Columbia University
K-Means Algorithm 2. Assign each object to the cluster whose center it is most close to. 3. Go back to Step 1, or stop if center do not change. Data Mining - Volinsky - 2011 - Columbia University
The K-Means Clustering Method • Example Data Mining - Volinsky - 2011 - Columbia University
K-means • Decide on clusters. (e.g. K=5) • (Example is courtesy of Andrew Moore, CMU) Data Mining - Volinsky - 2011 - Columbia University
K-means • Decide on Clusters. (e.g. K=5) • Randomly guess K cluster Center locations Data Mining - Volinsky - 2011 - Columbia University
K-means • Decide on clusters. (e.g. K=5) • Randomly guess K cluster Center locations • Each datapoint finds out which Center it’s closest to. (Thus each Center “owns” a set of datapoints) Data Mining - Volinsky - 2011 - Columbia University
K-means • Decide on clusters. (e.g. k=5) • Randomly guess k cluster Center locations • Each datapoint finds out which Center it’s closest to. • Each Center finds the centroid of the points it owns Data Mining - Volinsky - 2011 - Columbia University
K-means • Decide on clusters. (e.g. k=5) • Randomly guess k cluster Center locations • Each datapoint finds out which Center it’s closest to. • Each Center finds the centroid of the points it owns • New Centers => new boundaries • Repeat until no change Data Mining - Volinsky - 2011 - Columbia University
K-Means Example • Given: {2,4,10,12,3,20,30,11,25}, k=2 • Randomly assign means: m1=3,m2=4 • Solve for the rest …. Data Mining - Volinsky - 2011 - Columbia University
K-Means Example • Given: {2,4,10,12,3,20,30,11,25}, k=2 • Randomly assign means: m1=3,m2=4 • K1={2,3}, K2={4,10,12,20,30,11,25}, m1=2.5,m2=16 • K1={2,3,4},K2={10,12,20,30,11,25}, m1=3,m2=18 • K1={2,3,4,10},K2={12,20,30,11,25}, m1=4.75,m2=19.6 • K1={2,3,4,10,11,12},K2={20,30,25}, m1=7,m2=25 • Stop as the clusters with these means are the same. Data Mining - Volinsky - 2011 - Columbia University
Best value of k Average distance to centroid k Getting k Right • Hard! Often done subjectively (by feel) • Try different k, looking at the change in the average distance to centroid, as k increases. • Looking for a balance between within-cluster variance and between-cluster variance. • Calinski Index = • Average falls rapidly until right k, then changes little. Data Mining - Volinsky - 2011 - Columbia University
Comments on the K-Means Method • Strength • Relatively efficient: Easy to implement - often comes up with good, if not best, solutions • intuitive • Weakness • Need to specify k, the number of clusters, in advance • Unable to handle noisy data and outliers • Not suitable to discover clusters with non-convex shapes • Quite sensitive to initial starting points - will find a local optimum. Do it several times and see how much the results change Data Mining - Volinsky - 2011 - Columbia University
Variations on k-means • Make it more robust by using k-modes or k-mediods • K-Medoids: medoids are the most centrally located object in a cluster. • Make the initialization better • Take a small random sample and cluster to find a starting point • Pick k points on a grid, • Do several runs with different starting points Data Mining - Volinsky - 2011 - Columbia University
Clustering Outline • Introduction to Clustering • Distance measures • k-means clustering • Hierarchical clustering • Probabalistic clustering Data Mining - Volinsky - 2011 - Columbia University
Simple example of hierarchical clustering Data Mining - Volinsky - 2011 - Columbia University
Step 0 Step 1 Step 2 Step 3 Step 4 agglomerative a a b b a b c d e c c d e d d e e divisive Step 3 Step 2 Step 1 Step 0 Step 4 Hierarchical Clustering • Does not require the number of clusters k as an input. • Two extremes • All data in one cluster • Each data point in its own cluster Data Mining - Volinsky - 2011 - Columbia University
Hierarchical Clustering • Representation: tree of nested clusters • Greedy algorithm • Find two most similar points • Join them • Repeat • Can also run backwards • divisive • Effective visualization via “dendrograms” • shows nesting structure • merges or splits = tree nodes • Algorithm requires a distance metric for distance between clusters, or between a point and a cluster Data Mining - Volinsky - 2011 - Columbia University
Distances Between Clusters • Single Link: • smallest distance between points • Nearest neighbor • can be outlier sensitive • Complete Link: • largest distance between points • enforces “compactness” • Average Link: • mean - gets average behavior • centroid - more robust • Ward’s measure • Merge clusters that minimize increase in within-cluster distances: • D(i,j) = ( (SS(Ci+j) - SS(Cj) - SS(Ci) ) Data Mining - Volinsky - 2011 - Columbia University
Dendrograms • By cutting the dendrogram at the desired level, then each connected component forms a cluster. ABC DEF G HI A B C D E F G H I
Old Faithful data Data Mining - Volinsky - 2011 - Columbia University
Can make plots so the height of the cross-bar shows the change in within-cluster SS Data Mining - Volinsky - 2011 - Columbia University
Dendrogram Using Single-Link Method Old Faithful Eruption Duration vs Wait Data Notice how single-link tends to “chain”. dendrogram y-axis = crossbar’s distance score Data Mining - Volinsky - 2011 - Columbia University
Dendogram Using Ward’s SSE Distance More balanced than single-link. Old Faithful Eruption Duration vs Wait Data Data Mining - Volinsky - 2011 - Columbia University
Hierarchical Clustering • Pros • don’t have to specify k beforehand • visual representation of various cluster characteristics from dendogram • Cons • different linkage options get very different results Data Mining - Volinsky - 2011 - Columbia University
Clustering Outline • Introduction to Clustering • Distance measures • k-means clustering • Hierarchical clustering • Probabalistic clustering Data Mining - Volinsky - 2011 - Columbia University