Download
1 / 1
20 likes | 135 Views
( a ). PYS. TYS. CA. PNS. SYS. 100. Percentage of oocytes. 80. 60. 40. 20. 0. N1 N2 TR H4 H3 H2 H1. Supplementary Figure 2.

E N D
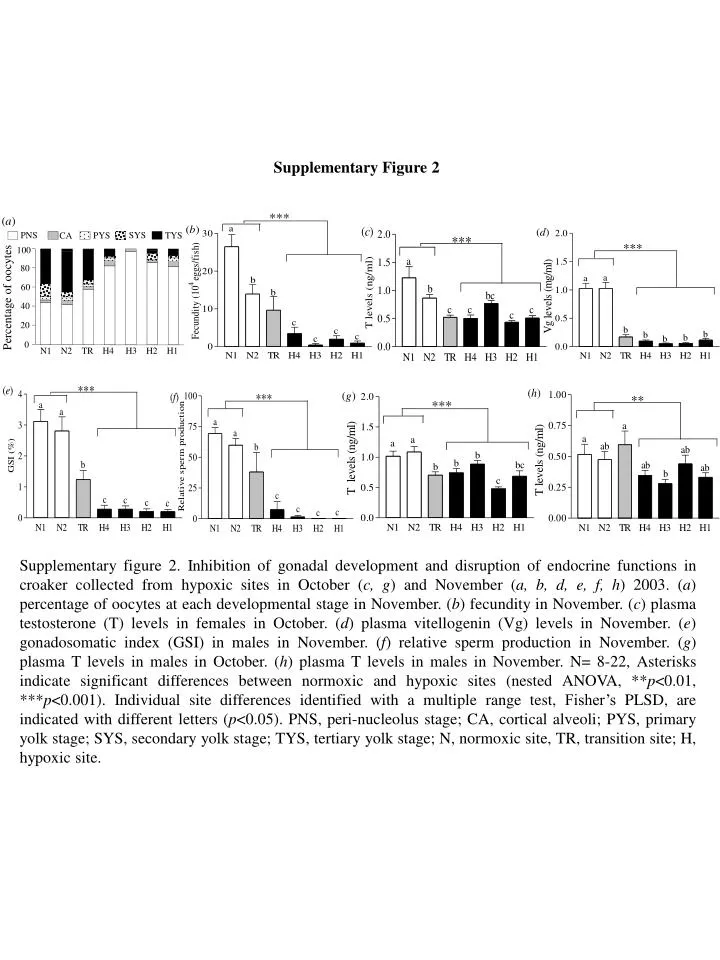
(a) PYS TYS CA PNS SYS 100 Percentage of oocytes 80 60 40 20 0 N1 N2 TR H4 H3 H2 H1 Supplementary Figure 2 Supplementary figure 2. Inhibition of gonadal development and disruption of endocrine functions in croaker collected from hypoxic sites in October (c, g) and November (a, b, d, e, f, h) 2003. (a) percentage of oocytes at each developmental stage in November. (b) fecundity in November. (c) plasma testosterone (T) levels in females in October. (d) plasma vitellogenin (Vg) levels in November. (e) gonadosomatic index (GSI) in males in November. (f) relative sperm production in November. (g) plasma T levels in males in October. (h) plasma T levels in males in November. N= 8-22, Asterisks indicate significant differences between normoxic and hypoxic sites (nested ANOVA, **p<0.01, ***p<0.001). Individual site differences identified with a multiple range test, Fisher’s PLSD, are indicated with different letters (p<0.05). PNS, peri-nucleolus stage; CA, cortical alveoli; PYS, primary yolk stage; SYS, secondary yolk stage; TYS, tertiary yolk stage; N, normoxic site, TR, transition site; H, hypoxic site.