Download
1 / 1
10 likes | 153 Views
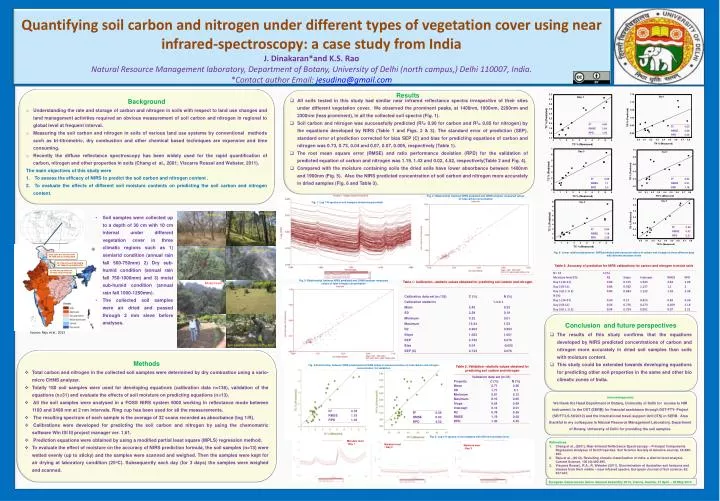
Results . Background Understanding the rate and storage of carbon and nitrogen in soils with respect to land use changes and land management activities required an obvious measurement of soil carbon and nitrogen in regional to global level at frequent interval.

E N D
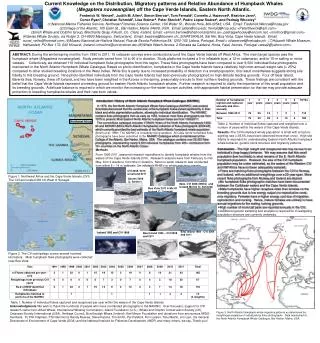
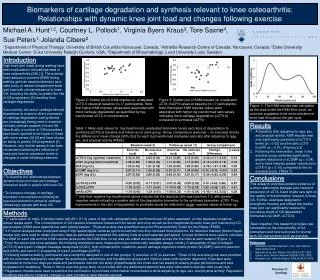
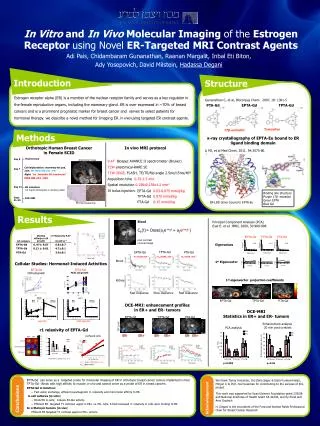
Results • Background • Understanding the rate and storage of carbon and nitrogen in soils with respect to land use changes and land management activities required an obvious measurement of soil carbon and nitrogen in regional to global level at frequent interval. • Measuring the soil carbon and nitrogen in soils of various land use systems by conventional methods such as tri-titrometric, dry combustion and other chemical based techniques are expensive and time consuming. • Recently the diffuse reflectance spectroscopy has been widely used for the rapid quantification of carbon, nitrogen and other properties in soils (Chang et al., 2001; ViscarraRossel and Webster, 2011). • The main objectives of this study were • To assess the efficacy of NIRS to predict the soil carbon and nitrogen content . • To evaluate the effects of different soil moisture contents on predicting the soil carbon and nitrogen content. • All soils tested in this study had similar near infrared reflectance spectra irrespective of their sites under different vegetation cover. We observed the prominent peaks, at 1400nm, 1900nm, 2200nm and 2300nm (less prominent), in all the collected soil spectra (Fig. 1). • Soil carbon and nitrogen was successfully predicted (R2= 0.90 for carbon and R2= 0.85 for nitrogen) by the equations developed by NIRS (Table 1 and Figs. 2 & 3). The standard error of prediction (SEP), standard error of prediction corrected for bias SEP (C) and bias for predicting equations of carbon and nitrogen was 0.73, 0.73, 0.04 and 0.07, 0.07, 0.005, respectively (Table 1). • The root mean square error (RMSE) and ratio performance deviation (RPD) for the validation of predicted equation of carbon and nitrogen was 1.19, 1.43 and 0.02, 4.52, respectively(Table 2 and Fig. 4). • Compared with the moisture containing soils the dried soils have lower absorbance between 1400nm and 1900nm (Fig. 5). Also the NIRS predicted concentration of soil carbon and nitrogen more accurately in dried samples (Fig. 6 and Table 3). Quantifying soil carbon and nitrogen under different types of vegetation cover using near infrared-spectroscopy: a case study from India J. Dinakaran*and K.S. RaoNatural Resource Management laboratory, Department of Botany, University of Delhi (north campus,) Delhi 110007, India. *Contact author Email: jesudina@gmail.com Fig. 2: Relationship between NIRS predicted and CHNS analyzer measured values of total carbon concentration Fig. 1: Log 1/R spectra of soil samples (dried and grounded) Pinussps Prosopissps • Soil samples were collected up to a depth of 30 cm with 10 cm interval under different vegetation cover in three climatic regions such as 1) semiarid condition (annual rain fall 500-750mm) 2) Dry sub-humid condition (annual rain fall 750-1000mm) and 3) moist sub-humid condition (annual rain fall 1000-1250mm). • The collected soil samples were air dried and passed through 2 mm sieve before analyses. Rhododendron sps Quercussps Fig. 6: Linear relationship between NIRS predicted and measured values of carbon and nitrogen at three different days with different moisture levels 33°23‘32.41"N to 33°33‘41.00"N 74°18‘38.42"E to 74°34‘52.00"E 30°17'03.97"N to 30°39'52.56"N 78° 19'46.6"E to 78°59'30.37"E Table 3: Accuracy of prediction for NIRS calibrations for carbon and nitrogen in moist soils 27°07’6"N to 28°32‘10.6"N 77°10‘33.7"E to 77°33‘9"E Fig. 3: Relationship between NIRS predicted and CHNS analyzer measured values of total nitrogen concentration Table 1: Calibration –statistic values obtained for predicting soil carbon and nitrogen Mixed cover Pasture land Agricultural field • Conclusion and future perspectives • The results of this study confirms that the equations developed by NIRS predicted concentrations of carbon and nitrogen more accurately in dried soil samples than soils with moisture content. • This study could be extended towards developing equations for predicting other soil properties in the same and other bio climatic zones of India. Source: Raju et al., 2013 Soil sample collection in the field • Methods • Total carbon and nitrogen in the collected soil samples were determined by dry combustion using a vario-micro CHNS analyzer. • Totally 180 soil samples were used for developing equations (calibration data n=136), validation of the equations (n=31) and evaluate the effects of soil moisture on predicting equations (n=13). • All the soil samples were analysed in a FOSS NIRS system 5000 working in reflectance mode between 1100 and 2498 nm at 2 nm intervals. Ring cup has been used for all the measurements. • The resulting spectrum of each sample is the average of 32 scans recorded as absorbance (log 1/R). • Calibrations were developed for predicting the soil carbon and nitrogen by using the chemometric software Win ISI III project manager ver. 1.61. • Prediction equations were obtained by using a modified partial least square (MPLS) regression method. • To evaluate the effect of moisture on the accuracy of NIRS prediction formula, the soil samples (n=13) were wetted evenly (up to sticky) and the samples were scanned and weighed. Then the samples were kept for air drying at laboratory condition (25oC). Subsequently each day (for 3 days) the samples were weighed and scanned. Fig. 4 Relationship between NIRS predicted and CHNS analyzer measured values of total carbon and nitrogen concentration for validation Table 2: Validation –statistic values obtained for predicting soil carbon and nitrogen Acknowledgements We thank the Head Department of Botany, University of Delhi for access to NIR instrument, to the DST (SERB) for financial assistance through DST-FTY- Project (SR/FT/LS-59/2012) and the International travel support Unit (ITS) in SERB. Also thankful to my colleagues in Natural Resource Management Laboratory, Department of Botany, University of Delhi for providing the soil samples. Fig. 5: Log 1/R spectra of soil samples with different moisture level References Chang et al., (2001). Near-Infrared Reflectance Spectroscopy – Principal Components Regression Analyses of Soil Properties. Soil Science Society of America Journal, 65:480-490. Raju et al., (2013). Revisiting climatic classification in India: a district-level analysis. Current Science, 105 (4):492-495. ViscarraRossel., R.A., R. Webster (2011). Discrimination of Australian soil horizons and classes from their visible – near infrared spectra. European Journal of Soil science, 62: 637-647. Moisture level : Day 1 Moisture level : Day 2 Moisture level : Day 3 European Geosciences Union General Assembly 2014, Vienna, Austria, 27 April – 02 May 2014