Download
1 / 1
10 likes | 125 Views
Overview of EDDIES Transect Cruises in the Sargasso Sea (OS16D-07). EDDIES Transect 1 (EDT1) June 23 rd – July 2 nd , 2004 Rod Johnson (BBSR, Bates, Hydrography) Steve Bell (BBSR, Bates, Hydrography) Megan Roadman (BBSR, Bates, Hydrography) Meg Murphy (BBSR/UCSB, Optics)

E N D
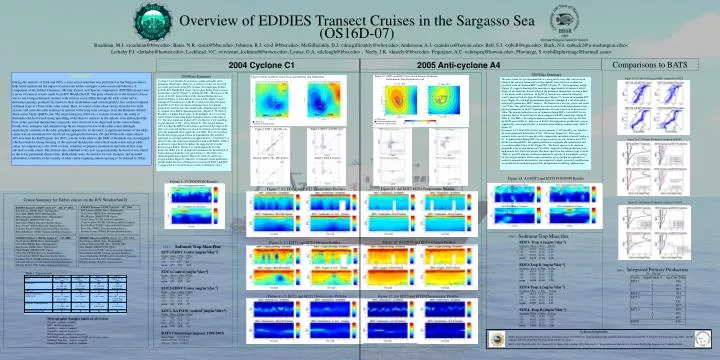
Overview of EDDIES Transect Cruises in the Sargasso Sea (OS16D-07) EDDIES Transect 1 (EDT1) June 23rd – July 2nd, 2004 Rod Johnson (BBSR, Bates, Hydrography) Steve Bell (BBSR, Bates, Hydrography) Megan Roadman (BBSR, Bates, Hydrography) Meg Murphy (BBSR/UCSB, Optics) Matt Allen (WHOI, Buesseler thorium fluxes) Brian Pointer (WHOI, Buesseler thorium fluxes) Courtney Ewart (UCSB, Carlson microbial dynamics) Meredith Meyers (UCSB, Carlson microbial dynamics) Roadman, M.J. <roadman@bbsr.edu>; Bates, N.R. <nick@bbsr.edu>; Johnson, R.J. <rod @bbsr.edu>; McGillicuddy, D.J. <dmcgillicuddy@whoi.edu>; Andersson, A.J. <aanderss@hawaii.edu>; Bell, S.J. <sjbell@uga.edu>; Buck, N.J. <nbuck2@u.washington.edu>; Lethaby P.J. <lethaby@hawaii.edu>; Lochhead, V.C. <vivienne_lochhead@brown.edu>; Lomas, D.A. <dclough@bbsr.edu> ; Neely, J.K. <kneely@bbsr.edu>; Pequignet, A.C. <chrispeq@hawaii.edu>; Pluvinage, S <sybillepluvinage@hotmail.com> 2004 Cyclone C1 2005 Anti-cyclone A4 Comparisons to BATS 2005Data Summary 2004Data Summary Figure 10:EDT3 and EDT4 Cruise Track, Primary Production and Sediment Trap Deployment in A4 ABSTRACT During the summer of 2004 and 2005, a joint vessel operation was performed in the Sargasso Sea to help better understand the impact of mesoscale eddies on upper ocean ecosystem behavior. A component of this Eddies Dynamics, Mixing, Export, and Species composition (EDDIES) project was a series of transect cruises made from R/V Weatherbird II. The prior objectives of the transect cruises was to run bioegeochemical sections with stations every 40km through the eddy center and to determine primary productivity (dawn to dusk incubations) and vertical particle flux (surface tethered sediment traps at 150m) at the eddy center. Here, we report on the observations from the two field seasons and asses the eddy response in relation to the long term averages from the Bermuda Atlantic Time-series Study (BATS) site. The target feature in 2004 was a cyclone located to the south of Bermuda which revealed strong upwelling of the density surfaces in the aphotic zone although at the base of the seasonal thermocline isopycnals were observed to be depressed in the water column. Productivity estimates and sediment trap fluxes found to be low at the eddy center although surprisingly estimates at the eddy periphery appeared to be elevated. A significant feature of the eddy center was an anomalous low dissolved oxygen profile between 150 and 400m with values almost 40% less than the BATS mean. For 2005, a mode water eddy to the SSW of Bermuda was investigated which revealed a strong shoaling of the seasonal thermocline and a thick mode water lens at eddy center. In comparison to the 2004 cyclone, estimates of primary production and vertical flux were elevated at eddy center. This feature also exhibited a very low oxygen anomaly however it was found in the lower permanent thermocline. Both eddies were observed to be very dynamic and revealed substantial variability in the vicinity of eddy center requiring station spacing to be reduced to 20km. Figure 2: EDT1 and EDT2 Cruise Track and Sediment Trap Deployment Figure 19: C1 and A4 Oxygen profiles compared to BATS The anti-cyclone A4 was determined to be a strong mode water eddy with observed lifting of the seasonal thermocline into the euphotic zone which was evident and persistent at the EC between EDT 3 and EDT 4 (Figure 15). The temperature profile (Figure 15) suggests shoaling of the nutricline to approximately 60 meters at the EC. Figure 15 also illustrates down-welling of the permanent thermocline, creating a thick (> 300 meter) mode water layer. In the EC of A4 there was enhanced biological activity observed with the high ctd fluorescence (Figure 17), increased suspended POC levels (Figure 18), and high phytoplankton pigments (chlorophyll a and fucoxanthin) indicated by preliminary HPLC analysis. The fluorescence was very patchy and varied over 20 km. The spatial heterogeneity was extensive in both the biogeochemical and physical parameters in the EC requiring distance between stations to be decreased to 10km. The primary production was not enhanced during EDT 3, but in EDT 4 it was extremely high at 60 and 80 meters when compared to BATS climatology (Figure 21, Table 4). For EDT 4, the integrated primary production was three times greater than the BATS mean (Table 4). However, at the EC, the high primary productivity was not supported by vertical particle flux as measured in the drifting sediment traps (Table 2, Figure 21). In contrast to C1 from 2004, the low oxygen anomaly (< 125 mmol/kg) was found in the lower permanent thermocline at 700 – 800 meters (Figure 16). The oxygen anomaly in the core of A4 coincides with a temperature and salinity anomaly similar to C1. It appeared that during EDT3 the oxygen anomaly was only found in one CTD profile, but during EDT4, this signal intensified in magnitude and spatial extent and was evident within 50 km of EC (Figure 19). The deficit appears to be similar in magnitude to the oxygen minima of C1 in 2004, suggestive of high productivity and high particle flux. The lower particle flux than expected in the sediment traps at A4 EC (Table 3), possibly indicates another mechanism for particles to reach depths causing the low oxygen anomaly. If the oxygen anomaly is of local origin an explanation is needed to demonstrate how particles are transported to depth, or possibly modifications are needed for the method of particle flux determination by drifting sediment traps. Cyclone C1 was found to be an intense cyclone noticeable in the permanent thermocline. However, in contrast to what was observed two weeks previously on the R/V Oceanus, the temperature profiles from the R/V Weatherbird transect do not show lifting of the seasonal thermocline at the EC (Figure 7). During the NW – SE transect of the survey of the EC, down-welling of the seasonal thermocline was observed (Figure 7), but it did not occur at the EC. Figure 7 shows thinning of the mode water at the EC to almost less than 100 meters. At the EC of C1 there was decreased fluorescence, low primary productivity, and low mass flux found in the sediment traps at 150m, by comparison to BATS climatological data. (Figures 9, 20, Table 2) But there is a higher fluorescence on the periphery of C1 versus the center (Figure 9) indicating higher biological activity at the edge of C1. The most significant feature of C1 was the low (< 160 mmol/kg) oxygen anomaly at 150 – 400 m (Figure 8). This oxygen minima (40% less than the BATS mean) brings to question of the origin of the eddy core water and whether it is a local or a foreign advected signal, given the magnitude of the signal (Li et al 2006). If it were assumed that the low oxygen signal is from local production, this would be equivalent to a nitrogen utilization of approximately 1.5 mol N/m^2, or almost 3 times the annual new production found at the BATS. If this is an advective signal than it downplays the suggestion of a locally driven oxygen deficit. However, it would support the fact that mesoscale eddies may be an important mechanism for the transport of biogeochemical properties over great distances. The little or no enhanced production at the EC (Figure 20. Table 4), and the low oxygen minima (Figure 8), indicative of remnants of past production, and the further decrease of fluorescence between the EDT 1 and EDT 2, suggest that C1 was in the process of decay during the survey. CTD Casts Production deployments CTD Casts Sediment Trap Position Sediment Trap Position Figure 3: EDT 1: All CTD casts Figure 5: EDT 2: All CTD casts Figure 11: Figure 13: Figure 20: C1 Primary Production compared to BATS Figure 4: EDT 1: NE - SW Transect Figure 6: EDT 2: Transect Figure 12: Figure 14: Figure 18: A4 EDT3 and EDT4 POC/PON Results Figure 1: C1 POC/PON Results Figure 15: A4 EDT3 EDT4 Temperature Profiles Figure 7: C1 EDT1 and EDT2 Temperature Profiles Cruise Summary for Eddies cruises on the R/V Weatherbird II Figure 21: A4 Primary Production compared to BATS EDDIES Transect 3 (EDT3) July 6th – 15th, 2005 Rod Johnson (BBSR, Bates, Hydrography) Deb Lomas (BBSR, Bates, Hydrography) Meg Murphy (BBSR/UCSB, Optics) Craig Carlson (UCSB, microbial dynamics) Courtney Ewart (UCSB, Carlson microbial dynamics) Elisa Wallner (UCSB, Carlson microbial dynamics) Steve Pike (WHOI, Busseler thorium fluxes) Elizabet Veremy (WHOI, Busseler thorium fluxes) Sediment Trap Mass flux Table 3: EDDIES Transect 2 (EDT2) August 2nd – 11th, 2004 Rod Johnson (BBSR, Bates, Hydrography) Steve Bell (BBSR, Bates, Hydrography) Deb Lomas (BBSR, Bates, Hydrography) Meg Murphy (BBSR/UCSB, Optics) Steve Pike (WHOI, Buesseler thorium fluxes) Carl Lamborg (WHOI, Buesseler thorium fluxes) Courtney Ewart (UCSB, Carlson microbial dynamics) Meredith Meyers (UCSB, Carlson microbial dynamics) Rhonda Marhol (UW, Ambrust eukaryote dynamics) EDDIES Transect 4 (EDT4) August 17th – 27th, 2005 Rod Johnson (BBSR, Bates, Hydrography) Andreas Andersson (UH, Bates, Hydrography) Meg Murphy (BBSR/UCSB, Optics) Courtney Ewart (UCSB, Carlson microbial dynamics) Elisa Wallner (UCSB, Carlson microbial dynamics) Jessica VanLeuvan (UCSB, Carlson microbial dynamics) Paul Henderson (Busseler, thorium fluxes) Elizabet Veremy (Busseler, thorium fluxes) Figure 16: A4 EDT3 and EDT4 Oxygen Profiles Figure 8: C1 EDT1 and EDT2 Oxygen Profiles EDT3- Trap A [mg/m-2/day-1] Depth(m) Mass C-Flux N-Flux 150 69.43 16.18 2.34 150 81.35 15.06 2.23 150 92.85 20.25 3.10 mean 81.21 17.16 2.56 EDT3-Trap B [mg/m-2/day-1] Depth(m) Mass C-Flux N-Flux 150 65.14 15.91 2.08 150 64.45 14.56 2.24 150 53.36 13.42 2.27 mean 60.98 14.63 2.20 EDT4-Trap A [mg/m-2/day-1] Depth(m) Mass C-Flux N-Flux 150 65.24 11.37 2.01 150 73.91 13.82 2.40 150 64.83 12.16 2.21 mean 67.99 12.45 2.21 EDT4- Trap B [mg/m-2/day-1] Depth(m) Mass C-Flux N-Flux 150 72.91 14.84 2.51 150 48.60 11.06 1.64 150 55.55 11.09 1.91 mean 59.02 12.33 2.02 Sediment Trap Mass Flux Table 2 : EDT1-EDDY Center [mg/m-2/day-1] Depth Mass C-Flux N-Flux 150 58.8 17.9 2.7 150 71.7 20.7 2.6 mean 65.3 19.3 2.65 EDT1-Control [mg/m-2/day-1] Depth Mass C-Flux N-Flux 150 47.9 12.7 1.9 mean 47.9 12.7 1.9 EDT2-EDDY Center [mg/m-2/day-1] Depth Mass C-Flux N-Flux 150 52.6 14.8 2.3 150 92.3 34.3 5.2 150 59.3 20.0 3.1 mean 68.1 23.0 3.5 EDT2- BATS190 ‘control’ [mg/m-2/day-1] Depth Mass C-Flux N-Flux 150 55.5 21.2 3.4 150 62.1 17.6 2.4 150 113.2 29.5 4.0 mean 77.0 22.8 3.3 BATS Climatology(summer 1988-2003) Mass(150m) 107.8 39.0 Carbon (150m) 27.2 8.0 Nitrogen (150m) 4.3 1.5 Table 4: Integrated Primary Production Table 1: Cruise Events (0 - 140 m) Cruise deployment # mg C/m^2/day EDT 1 1 536 2 367 3 307 EDT 2 1 594 EDT 3 1 200 2 311 3 307 EDT 4 1 808 2 650 3 605 BATS 426 Figure 9: C1 EDT1 and EDT2 Fluorescence Profiles Figure 17: A4 EDT3 and EDT4 Fluorescence Profiles Hydrographic Samples taken on all cruises Oxygens - analysis complete DIC - analysis in progress Salinities - analysis complete Nutrients – analysis in progress HPLC pigments – analysis in progress POC/PON - analysis complete for WBII and Oceanus cruises Sediment Trap Flux - analysis complete Primary Production - analysis complete Acknowledgments Eddies project funded by National Science Foundation grant OCE-0241310. Special thanks to the scientific and technical staff of BATS, V Kosnyrev for data processing effots, and the captains and crew of the R/V Weatherbird II and R/V Oceanus. Ref: Li, Q.P; McGillicuddy, D.J., Hansell, D.A.; Bates, N.R.; Jenkins, W.J.; Johnson, R.J. “Biogeochemical Impacts of a Cyclonic Eddy in the Sargasso Sea” submitted 2006