Download
1 / 21
210 likes | 223 Views
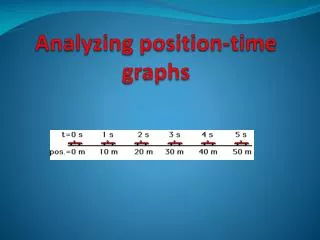
Position-Time and Velocity-Time Graphs. Position-Time Graphs Review. What information does the slope on a P-T Graph show you?. 50. change in y. slope =. 40. change in x. 30. position (m). (30 m – 10 m). 20. slope =. (30 s – 0 s). 10. (20 m). 10. 20. 30. 40. slope =. (30 s).

E N D
Position-Time Graphs Review • What information does the slope on a P-T Graph show you?
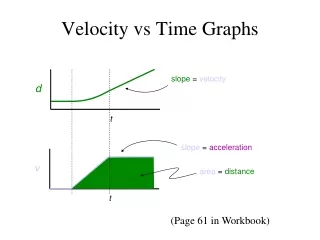
50 change in y slope = 40 change in x 30 position (m) (30 m – 10 m) 20 slope = (30 s – 0 s) 10 (20 m) 10 20 30 40 slope = (30 s) time (s) Position-Time Graphs • The slope of a P-T graph is equal to the object’s velocity in that segment. slope = 0.7 m/s
10 9 8 7 6 5 4 3 2 1 1 2 3 4 5 6 7 9 10 8 Position-Time Graphs position (cm) time (s)
10 9 8 7 6 5 position (cm) 4 3 2 1 time (s) 1 2 3 4 5 6 7 9 10 8 Position-Time Graphs • What are the characteristics of this graph? • Diagonal line, positive slope • What kind of motion created this graph? • Constant velocity
Position-Time Graphs • Each type of motion has a characteristic shape on a P-T graph. • Constant speed • Zero speed (at rest) • Accelerating (speeding up) • Decelerating (slowing down)
time (s) time (s) pos. (m) pos. (m) Constant speed in positive direction. Moving away from 0 Constant speed in negative direction. Moving toward zero Position-Time Graphs • Constant velocity is represented by a diagonal line on the P-T graph.
time (s) pos. (m) A horizontal segment means the object is at rest. Position-Time Graphs • At Rest is represented by a horizontal line on the P-T graph.
time (s) time (s) pos. (m) pos. (m) Speeding up in positive direction. Speeding up in negative direction. Position-Time Graphs • Curved segments on the P-T graph mean the object’s speed is changing.
time (s) time (s) pos. (m) pos. (m) Traveling in positive direction, but slowing down. Traveling in negative direction, but slowing down. Position-Time Graphs • Curved segments on the P-T graph mean the object’s speed is changing.
50. change in y slope = 40. change in x velocity (m/s) 30. (50. m/s – 10. m/s 20. slope = (3.0 s – 0 s) 10. (40. m/s) 1.0 2.0 3.0 4.0 slope = (3.0 s) time (s) Velocity -Time Graphs • The slope of a V-T graph is equal to the object’s acceleration in that segment. slope = 13 m/s2
+ velocity (m/s) time (s) - Velocity-Time Graphs • This Graph shows an object moving with a constant positive velocity, but No Acceleration Object is moving with a constant velocity in the (+) direction
+ velocity (m/s) time (s) - Velocity-Time Graphs • This graph shows an object moving with a constant negative velocity, but no acceleration Object is moving with a constant velocity in (-) direction
+ velocity (m/s) time (s) - Velocity-Time Graphs • This graph shows an object not moving. Object is at rest
Acceleration is a Vector • Because acceleration is a vector, we also have to include a direction. • Acceleration is a vector that points in the same direction as the change in velocity. • Therefore; the direction of acceleration is determined by the direction of the slope.
+ + velocity (m/s) velocity (m/s) time (s) time (s) The direction of the slope indicates whether acceleration is positive or negative: This object is speeding up in the positive direction This object has a positive slope; therefore a positive acceleration. This object is slowing down in the negative direction - - Velocity-Time Graphs • V-T Graphs that show Positive Accelerations
+ + velocity (m/s) velocity (m/s) time (s) time (s) This object has a negative slope; therefore acceleration will be negative. Object is slowing down in the positive direction This object has a negative slope; therefore acceleration will be negative. object is speeding up in the negative direction - - Velocity-Time Graphs • V-T graphs that show Negative Accelerations
Velocity-Time Graphs • A velocity-time (V-T) graph shows an object’s velocity as a function of time. • A horizontal line = constant velocity. • A straight sloped line = constant acceleration. • Acceleration = change in velocity over time. • Positive slope = positive acceleration. • Not necessarily speeding up! • Negative slope = negative acceleration. • Not necessarily slowing down!
Checkpoint Consider the graph at the right. The object whose motion is represented by this graph is ... (include all that are true): A. moving with positive velocity. B. moving with a constant velocity. C. moving with a negative velocity. D. slowing down. E. changing directions. F. speeding up. G. moving with a positive acceleration. H. moving with a negative acceleration
ANSWER • A,D, and H
RESEARCH • Explain how an object with a positive acceleration can be slowing down. • Explain how an object with a negative acceleration can be speeding up.