Download
1 / 31
310 likes | 394 Views
IS THERE A HIGHER C ANT STORAGE IN THE INDIAN OCEAN?. Estimating the storage of anthropogenic carbon in the subtropical Indian Ocean: a comparison of five different approaches

E N D
IS THERE A HIGHER CANT STORAGE IN THE INDIAN OCEAN? Estimating the storage of anthropogenic carbon in the subtropical Indian Ocean: a comparison of five different approaches M. Álvarez, C. Lo Monaco, T. Tanhua, A. Yool, A. Oschlies, J. L. Bullister, C. Goyet, N. Metzl, F. Touratier, E. McDonagh, and H. L. Bryden, Biogeosciences, 6, 681-703, 2009. http://www.biogeosciences-discuss.net/6/729/2009/bgd-6-729-2009.html
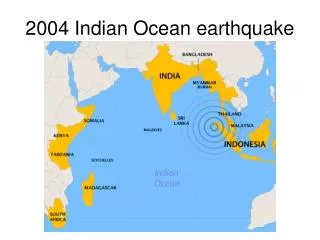
CANT ALONG CD139 CRUISE (2002) 32ºS INDIAN OCEAN CANT inventory referred to 1994 = 110 ± 13 Pg C Indian Ocean contains - 21% of the total CANT inventory - half of the Atlantic CANT inventory despite having only 20% less area Indian Ocean Atlantic Ocean Pacific Ocean 44.8 6 Pg 20.3 3 Pg 44.5 5 Pg (Sabine et al, Science 2004)
RedSea /Persian Gulf Intermediate Water Antarctic Intermediate Water (AAIW) AAIW marks the deepest CANT penetration in the Subtropical gyre No CANT in deep and bottom waters CANT ALONG CD139 CRUISE (2002) 32ºS INDIAN OCEAN Indian Ocean CANT vertical distribution mmol/kg (Sabine et al, Science 2004)
CANT ALONG CD139 CRUISE (2002) 32ºS INDIAN OCEAN Hypothesis: CANT penetrates deeper than 1000-1500 m How to assess this question: compare different CANT methods -> difficult: every method has high uncertainties help: relation of CANT with tracers (CFC12, CCl4)
CANT ALONG CD139 CRUISE (2002) 32ºS INDIAN OCEAN • On board R/V Charles Darwin, CD139 cruise, 1/3 – 15/4/2002, from Durban to Freemantle • P.I.: Harry Bryden (National Oceanographic Centre, Southampton, UK) • Physics: temperature, salinity, ADCP, LADCP • Chemistry: oxygen, salinity, nutrients, CO2 (pH & TA, TIC), CFCs (11, 12, 113), CCl4.
Salinity (psu) CANT ALONG CD139 CRUISE (2002) 32ºS INDIAN OCEAN Africa Australia SAMW SAMW SAMW SAMW AAIW AAIW AAIW AAIW NADW NADW NADW CDW AABW AABW
CANT ALONG CD139 CRUISE (2002) 32ºS INDIAN OCEAN Australia Africa CFC-12 (pmol/kg) SAMW SAMW SAMW AAIW AAIW AAIW CDW NADW CDW AABW AABW
CANT ALONG CD139 CRUISE (2002) 32ºS INDIAN OCEAN CANT TECHNIQUES CANT SAB99: method by Sabine et al. (GBC,1999), using their DCDis CANT LM05: method by LoMonaco et al. (JGR, 2005) CANT TrOCA: Touratier & Goyet (Tellus, 2007) CANT TTD CANT from OCCAM model
CANT ALONG CD139 CRUISE (2002) 32ºS INDIAN OCEAN Back-calculation technique by Sabine et al. (GBC, 1999) to estimate CANT. CANT = DC* - DCDis = C – AOU/RC – ½(TA + AOU/RN ) + 106/104 · N*- C280 – DCDis • C is the current total inorganic carbon • TA = TA - TA0, current alkalinity - preformed alkalinity TA0= 378.1 + 55.22 · Sal + 0.0716 · PO - 1.236 · Tpot • AOU is the Apparent Oxygen Utilization, assuming oxygen saturation • C280is the inorganic carbon in equilibrium with the preindustrial atmosphere. • C280 = f (Tpot, Sal, TA0, pCO2280) from thermodynamic equations • pCO2280 = CO2 fugacity at a 100% of water vapor pressure in uatm = f(Tpot, Sal, 280) • C280 in GSS96 => constants by Goyet & Poisson (1989) & a constant pCO2280 = 280 uatm • linearilized equation: • C280 = 2072 - 8.982 · (Tpot - 9) - 4.931 · (Sal - 35) + 0.842 · (TA0- 2320) • N* = (0.87 · (NO3 - 16 · PO4 + 2.9)) term accounting for the denitrification
CANT ALONG CD139 CRUISE (2002) 32ºS INDIAN OCEAN DCDisis obtained with own CD139 data using CFC12 ages and limit at 40 years • a) Old deep waters, CANT = 0 => DC* = DCDis • b) In upper waters, having the age: DCDis = DC*t|σ=cte • DC*t = C - CBio - C t where Ct = f (Tpot, Sal, TA0, pCO2t) • pCO2 in the atmosphere at 2002 – age (t) • c) In between => weigthed mean DC* and DC*t|s=cte
CANT ALONG CD139 CRUISE (2002) 32ºS INDIAN OCEAN Fig. 4. Air-sea CO2 disequilibrium (mmol kg-1) by density intervals. Blue points correspond to the values taken directly from SAB99 work, light blue and orange points correspond to the values estimated using the CD139 biogeochemical data, following SAB99 (orange) and combined (light blue) methods. Interpolated points are highlighted with black open circles.
CANT ALONG CD139 CRUISE (2002) 32ºS INDIAN OCEAN Back-calculation technique by Lo Monaco et al. (JGR, 2005): CANT = CT – CBio- CT0 obs – (CT– CBio – C0 obs) REF CT = measured TIC CBio = 0.73·(O20 – O2) + 0.5·(TA – TA0) => biological activity variation in TIC TA0 => preformed TA O20 = O2sat – a·K·O2Sat => aO2 = 12% undersaturation K = > mixing ratio of ice-covered water (OMP) C0 obs => preformed TIC currently observed in the formation area water masses REF = reference water where no CANT should be detected.
CANT ALONG CD139 CRUISE (2002) 32ºS INDIAN OCEAN Back-calculation technique by Lo Monaco et al. (JGR, 2005) TA0 = k(S) TA0(S) + k(N) TA0(NADW) C0,obs = k(S) C0,obs(S) + k(N) C0,obs(NADW) southern relationships: winter surface data from the Atlantic and Indian oceans (WOCE and OISO cruises) TA0(S) = 0.0685 PO + 59.787 S - 1.448 + 217.15 (± 5.5 µmol/kg, r2 = 0.96, n = 243) C0,obs(S) = -0.0439 PO + 42.79 S - 12.019 + 739.83(± 6.3 µmol/kg, r2 = 0.99, n = 428) northern relationships subsurface data from the North Atlantic and Nordic Seas (WOCE and KNORR cruises) TA0(N) = 42.711 S + 1.265 + 804.6(± 9.3 µmol/kg, r2 = 0.92, n = 297) C0,obs(N) = 10.69 S + 0.306 NO + 1631.6(± 9.2 µmol/kg, r2 = 0.79, n = 364) mixing ratios of southern and northern waters: k(S) + k(NADW) = 1 determined from OMP analysis
Tpot Salinity Tpot SiO2 Tpot NO CANT ALONG CD139 CRUISE (2002) 32ºS INDIAN OCEAN Back-calculation technique by Lo Monaco et al. (JGR, 2005): OMP analysis modified from Lo Monaco et al. (JGR, 2005) Endmembers: AAIW, NADW-E, NIDW, Indian Water, WDS/CDW, ISW Weddell Variables: Sal, Tpot, SiO2 and NO
CANT ALONG CD139 CRUISE (2002) 32ºS INDIAN OCEAN Back-calculation technique by Lo Monaco et al. (JGR, 2005): OMP Tpot, Sal, SiO2 NO STD Res. 0.0481 0.0051 1.3 3 R2 0.9979 0.9967 0.9973 0.9611 (n=1299)
CANT ALONG CD139 CRUISE (2002) 32ºS INDIAN OCEAN 2. Back-calculation technique by Lo Monaco et al. (JGR, 2005): OMP Africa Africa Australia Australia NADW contribution Ice-covered SW contribution
CANT ALONG CD139 CRUISE (2002) 32ºS INDIAN OCEAN Back-calculation technique by Lo Monaco et al. (JGR, 2005): CANT = CT – CBio- CT0 obs – (CT– CBio – C0 obs) REF • REF = NADW= reference water where no CANT should be detected. • Applied to samples with more 50% NADW from OMP analysis • (CT – CBio – C0 obs) REF = - 54.4 ± 1.4 umol/kg • (LoMonaco JGR2005 -51 umol/kg) CANT = CT – CBio- CT0 obs– (- 54.4)
CANT ALONG CD139 CRUISE (2002) 32ºS INDIAN OCEAN CANT TrOCA, Touratier et al (Tellus B, 2007): TrOCA = O2 + a · (CT -1/2 ·TA) a = ψO2 / [ψCO2 + ½ ·( ψ H+ − ψHPO24−)] CANT (TrOCA) = (TrOCA – TrOCA280) / a CANT = (O2 + 1.279 · (CT – 0.5 · TA) – exp (7.511-0.01087· θ -781000/TA2))/1.279)
CANT ALONG CD139 CRUISE (2002) 32ºS INDIAN OCEAN 4. CANT TTD (Waugh et al., 2004; 2006; Tanhua et al., 2008): - each water sample has its own “age”, i.e. time since it was last in contact with the atmosphere. The sum of all these ages makes the TTD of a water sample - the mean age ( ) and the width of the TTD () are assumed to be of equal magnitude: realistic assumption of the relation between advective and diffusive transport in the Ocean - CANT is an inert passive tracer where air-sea disequilibrium hasn’t changed over time.
CANT ALONG CD139 CRUISE (2002) 32ºS INDIAN OCEAN 5. CANT OCCAM • global, medium-resolution, primitive equation ocean general circulation model (Marsh et al., 2005). • OCCAM's vertical resolution is 66 levels (5 m thickness at the surface, 200 m at depth), with a horizontal resolution of typically 1 degree. • Advection is 4th order accurate, and the model is time-integrated using a forward leapfrog scheme with a 1 hour time-step. • Surface fluxes of heat and freshwater not specified but are calculated empirically using NCEP-derived atmospheric boundary quantities (Large and Yeager, 2004). • OCCAM incorporates a NPZD plankton ecosystem (Oschlies, 2001; Yool et al., 2007) which drives the biogeochemical cycles of nitrogen, carbon, oxygen and alkalinity.
pCFC12 & pCCl4 SAB99 LM05 Troca OCCAM TTD CANT ALONG CD139 CRUISE (2002) 32ºS INDIAN OCEAN CANT vertical distributions
CANT ALONG CD139 CRUISE (2002) 32ºS INDIAN OCEAN CANT mean profile differences
CANT ALONG CD139 CRUISE (2002) 32ºS INDIAN OCEAN Neutral density layers & salinity Australia Africa Surface SAMW AAIW Deep Bottom
CANT ALONG CD139 CRUISE (2002) 32ºS INDIAN OCEAN CANT mean inventories
CANT ALONG CD139 CRUISE (2002) 32ºS INDIAN OCEAN Surface, SAMW waters and upper AAIW Revelle = 10 Revelle = 13 Fig. 10. Partial pressure of CFC-12 (ppt) and CANT estimates (mmol kg-1) for upper waters with potential temperature higher than 5ºC, pressure higher than 200 dbar and CFC-12 age less than 30 years. Also shown in black is the atmospheric evolution of CFC-12 and CANT using Revelle factors of 10 and 13 (see text for details), some time markers are shown. pCFC-12
CANT ALONG CD139 CRUISE (2002) 32ºS INDIAN OCEAN Deep and bottom waters Fig. 11. a) Partial pressure of CFC-12 (ppt) and b) partial pressure of CCl4 (ppt) versus CANT (mmol kg-1) estimates for deep waters with potential temperature lower than 5ºC, pressure higher than 200 dbar and CFC-12 age higher than 40 years. In the case of CCl4, the temperature limit is 3ºC. Also shown in black are the atmospheric evolution of CFC-12, CCl4 and CANT using Revelle factors of 10 and 13 (see text for details), some time markers are shown.
CANT ALONG CD139 CRUISE (2002) 32ºS INDIAN OCEAN Inventories Table 1. Mean standard deviation CANT specific inventory (molC m-2) by water masses in the subtropical Indian Ocean for the different methods here evaluated. Mean and standard deviation values were obtained randomly modifying the initially calculated single CANT values by 5 mmol kg-1. A set of 100 perturbations were done for the five methods. The standard deviation for each layer is weighted by the layer contribution to the total section area. See text for the acronyms. N/D stands for not determined. Values between brackets correspond to the LM05 method assuming a 100% oxygen saturation in equation (7), =0. * The total specific inventory is calculated as the sum of the SAMW, AAIW, Deep and Bottom contributions plus 7 molC m-2, i.e., the TTD and OCCAM mean specific inventory for the upper layer.
CANT ALONG CD139 CRUISE (2002) 32ºS INDIAN OCEAN Conclusions This work investigates the CANT penetration and inventory in the subtropical Indian Ocean along 32ºS calculated with data collected in 2002. Five different methods are compared and discussed: three carbon-based methods (DC*, LM05 and TrOCA), TTD and a simulation from the OCCAM global model. Comparatively, the DC* method seems to yield too shallow penetration of CANT, with no or very low CANT detected in deep or bottom waters, mainly due to the formulation and assumptions of DCTdis. Our results indicate that SAB99 DCTdis values are inconsistent with the current air-sea CO2 disequilibrium found in current Indian Ocean winter DCTdis values. Although this could also be misleading taking into account that water masses are usually formed in particular times and areas of the ocean. Previous estimates of CANT inventory in the subtropical Indian Ocean with the DC* method appear to be underestimates. Considering the CANT estimates derived from those methods consistent with the tracer distributions and the knowledge about water masses, our best estimate for the mean CANT specific inventory is 282 molC m-2 which compares with 242 molC m-2 from DC*, 17% higher.
CANT ALONG CD139 CRUISE (2002) 32ºS INDIAN OCEAN • Hypothesis: • CANT penetrates deeper than 1000 m (Sabine et al 1999) • How to assess this question: • difficult: every method has uncertainties • help: relation of CANT with tracers (CFC12, CCl4) • seems to be hinted by any other method • absolutely true, no method is perfect • questions still arise, saturation, mixing, etc.. • community should combine methods and time-evolution studies at specially sensitive regions • OPEN DISCUSSION: KEY REGION ….. THE SO
CANT ALONG CD139 CRUISE (2002) 32ºS INDIAN OCEAN Discusión: ¿Cuáles son las asunciones de cada método? ¿nos creemos el desequilibrio? ¿Qué método os parece el más fiable? ¿Se os ocurre como evaluar los métodos de otra manera?