Download
1 / 17
210 likes | 421 Views
Radiosonde Data Analysis. Carrie Phelps MY NASA DATA Workshop August 5, 2004. Radiosonde Launch Network. What do meteorologists do with radiosonde data?. Reasons to collect radiosonde information. Can assess the stability of the atmosphere Can see weather elements at every layer

E N D
Radiosonde Data Analysis Carrie Phelps MY NASA DATA Workshop August 5, 2004
Reasons to collect radiosonde information • Can assess the stability of the atmosphere • Can see weather elements at every layer • Can determine potential for convection, forecast temperatures, character of severe weather • The data is used to produce weather forecast models
What are the disadvantages? • Only available twice a day (00Z and 12Z) • Character of weather can change dramatically between soundings • Sounding does not give a true vertical dimension since wind blows balloon downstream • Sounding does not give a true snapshot since it takes several minutes to travel from the surface to the upper troposphere
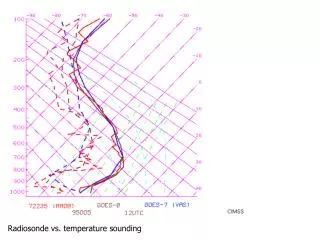
Graphing Radiosonde Data:The Skew T – Log PThermodynamic Diagram
LFC is at 656 mb CAPE is 1357 J/kg CINH is 305 J/kg There is currently a temperature inversion Moderate potential Moderately Unstable Must muster the energy! Will there be any storms today?
Temperature Inversions • Warm air over cool air • Restricts upward motions • Can cause fog or pollution problems
Formed by: Surface cooling at night Advection of warm air mass Subsidence (sinking air) Orographic features Temperature Inversions
Try to build a thunderstorm!http://profhorn.aos.wisc.edu/wxwise/thermo/tstm.html