Download
1 / 29
290 likes | 411 Views
Status of San Antonio Air Quality and Current Understanding of Oil and Gas Impacts. Bright Dornblaser, Ph.D. Air Modeling and Data Analysis Air Quality Division TCEQ Environmental Trade Fair May 6, 2014. Air Quality Division . Presentation Outline. Air Quality Status

E N D
Status of San Antonio Air Quality and Current Understanding of Oil and Gas Impacts Bright Dornblaser, Ph.D.Air Modeling and Data Analysis Air Quality Division TCEQ Environmental Trade Fair May 6, 2014 Air Quality Division
Presentation Outline • Air Quality Status • Emissions Contributing to Ozone • Alamo Area Council of Governments (AACOG) Rider 8 Modeling • Eagle Ford Shale Growth • Questions and Discussion
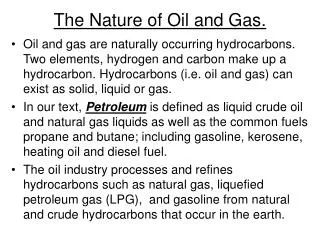
2008 Eight-Hour Ozone NAAQS • On May 21, 2012, the EPA published final designations and classifications for the 2008 eight-hour ozone NAAQS. • The San Antonio area (Bexar, Comal, Guadalupe, and Wilson Counties) was designated attainment/unclassifiable for the 0.075 parts per million (ppm) NAAQS. • The preliminary eight-hour ozone design value for 2013 as of September 30 is 81 parts per billion (ppb). • 2011 design value: 75 ppb • 2012 design value: 80 ppb
Ozone Monitors in SAN with 2013 Eight-Hour Ozone Design Values
What Emissions Contribute to Ozone in San Antonio?
Eagle Ford NOX Emissions by Year and Source Category, Moderate Scenario
Change in Eight-Hour Ozone Using Eagle Ford Emissions for 2012 and 2018
Change in San Antonio-New Braunfels MSA Eight-Hour Design Values, 2018
Drill Rig Projections 2013-2018 Actual Number of Drill Rigs, Oct. 2013
Texas Eagle Ford Shale Total Natural Gas Production 2008 through July 2013 Eagle Ford natural gas production high scenario projection: 1,267 MMcf per day for 2012
Texas Eagle Ford Shale Total Oil Production 2008 through July 2013 Eagle Ford oil production high scenario projection: 292,421 barrels per day for 2012
Projected Annual and Cumulative Oil Production in Eagle Ford 2012-2036 (Method 3)
Projected Annual and Cumulative Natural Gas Production in Eagle Ford 2012-2036 (Method 3)
Projected Annual and Cumulative Condensate Production in Eagle Ford 2012-2036 (Method 3)
HYSPLIT Back Trajectories in San Antonio Days in 2012 where ozone > 75ppb
Summary of TCEQ’s Analysis on San Antonio's Ozone • Slow wind speeds are associated with, and play an important role in high ozone days. • The majority of monitors record high ozone when winds are from the south; those monitors are located in the north part of the city. • Back trajectories on high ozone days show that local emissions (mobile and point sources) are an important component in explaining the cause of high ozone in San Antonio. • Eagle Ford Shale emissions effects on San Antonio are yet to be determined.
Contact Information Bright Dornblaser Air Modeling and Data Analysis (512) 239-1978 Bright.Dornblaser@tceq.texas.gov