Download
1 / 11
110 likes | 274 Views
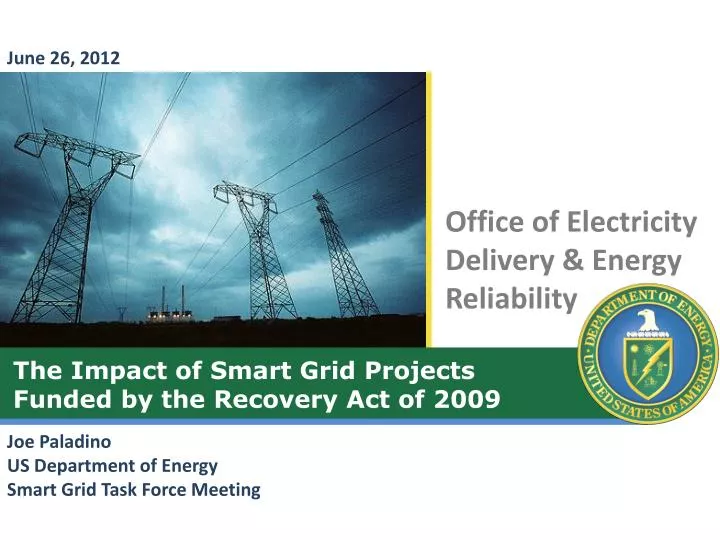
June 26, 2012. The Impact of Smart Grid Projects Funded by the Recovery Act of 2009. Joe Paladino US Department of Energy Smart Grid Task Force Meeting. SGIG Deployment Status. 9.3 of 15.5 million residential and commercial smart meters.

E N D
June 26, 2012 The Impact of Smart Grid Projects Funded by the Recovery Act of 2009 Joe Paladino US Department of Energy Smart Grid Task Force Meeting
SGIG Deployment Status 9.3 of 15.5 million residential and commercial smart meters Distribution automation equipment on 4,200 out of 6,500 circuits 195 out of over 800 networked phasor measurement units
Value of the Smart Grid * 2019 value including societal and GHG benefits Source: “McKinsey on Smart Grid”, McKinsey & Company, Summer 2010
Analytical Focus Advanced Metering Infrastructure Peak and Overall Demand Reduction (62 projects) Operational Efficiency Improvements (60 projects) Distribution Automation Reliability Improvements (48 projects) Efficiency Improvements (47 projects) Transmission System Applications Reliability and Efficiency Improvements (10 projects)
Pricing Pilot: OG&E OG&E deployed a CPP overlay on TOU and VPP in Summer 2011; VPP-CP rate highlighted here. Customers with PCT reduced peak demand by ~30% • Potentially Avoid Future Generation: • Study results show a 1.3 kW avg. peak load reduction per customer during events is possible • Goal of 20% participation by Dec 2014 in VPP-CP rate offering supported by high satisfaction rates • Achieving 20% participation goal (~150K residential customers) will allow OG&E to offset the need for a new natural gas-fired peaking plant (~210 MW)
Operational Efficiency Improvements at Talquin Electric Cooperative • Background: • For over 70 years, members submitted their own meter readings (highly inaccurate) • Rolling trucks 6,000 times/year for routine service connection/reconnection and 9,000 times/year for non-payment problems ($40-$50/truck roll) • Outage locations based on pattern of customer phone calls • TEC’s SmartGrid Program: • Deployed AMI to about 56,000 customers and upgraded 46 of 86 circuits with advanced capacitors for voltage control and outage management. • With AMI, TEC avoided 8,800 truck rolls in 2011 for non-payment problems saving more than $350,000 • Expecting to avoid additional 5,500 truck rolls for routine service connections (savings of $200,000/year) • Expecting to reduce outage durations from more precise pinpointing of faults and dispatching of repair crews to exact locations without guesswork. Technician changes out analog meter with a smart meter Facts & Figures Total Project Budget: $16,200,000 Federal Share: $ 8,100,000 Customers Served: 57,000 Service Area: 2,600 square miles spanning 4 counties in northern Florida
Reliability Improvements One utility has installed 230 automated feeder switches on 75 circuits in an urban area. From Apr 1 – Sep 30 2011: SAIDI improved 24%; average outage duration decreased from 72.3 minutes to 54.6 minutes (or by 17.7 minutes). Estimated Avg. Customer Interruption Costs US 2008$ by Customer Type and Duration Sullivan J, Michael, 2009 Estimated Value of Service Reliability for Electric Utility Customers in the US, LBNL 2132E, June 2009 VOS Improvement Δ = ΔSAIDI x Customers Served x Avg Load x VOS Coefficient *Sullivan J, Michael, 2009 Estimated Value of Service Reliability for Electric Utility Customers in the US, xxi
Conservation Voltage Reduction Objective: Reduce energy consumption and peak load via operating at the low end of the ANSI C84.1 Range A Band (114V – 126V) Near-real-time feedback loop enables optimized operation of these components. However, deployment strategies differ with respect to objectives and levels of sophistication. Load Tap Changer Voltage Regulators Capacitors Line Sensors NOTE: Utilities and regulatory commissions will need to work together to establish appropriate recovery of fixed costs as consumption is reduced DMS
Application of Synchrophasor Technology • Investments in synchrophasor technology are being made by 10 SGIG projects • Benefits: • Improved reliability and resiliency • Improved asset utilization • Reduced transmission congestion • Integration of distributed generation and renewables
Scope and Challenges • Adoption Rate Factors: • Economy • Policy • Technology • Consumer Acceptance • Reliability Needs SGIG Spending $7.9 billion with cost share to be spent through 2015 EPRI Estimate $338 - $476 billion needed through 2030 EPRI. Estimating the costs and benefits of the smart grid: A preliminary estimate of the investment requirements and the resultant benefits of a fully functioning smart grid. EPRI, Palo Alto, CA; 2011. Brattle Group Estimate $880 billion needed through 2030 Chupka, M.W. Earle, R., Fox-Penner, P., Hledik, R. Transforming America’s power industry: The investment challenge 2010 – 2030. Edison Electric Institute, Washington D.C.,: 2008.