Download
1 / 28
280 likes | 388 Views
SSM Health Care. Category 4: Information and Analysis. Information and Analysis. The MBNQA Information & Analysis criteria SSM’s approach to information management and measurement Information systems infrastructure Performance Management Process Use of comparative data. MBNQA Categories.

E N D
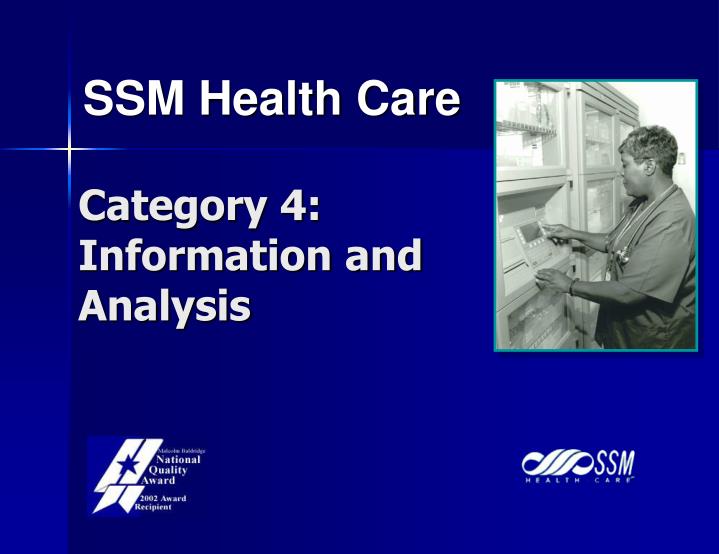
SSM Health Care Category 4: Information and Analysis
Information and Analysis • The MBNQA Information & Analysis criteria • SSM’s approach to information management and measurement • Information systems infrastructure • Performance Management Process • Use of comparative data
MBNQA Categories • Leadership • Strategic Planning • Focus on Patients, Other Customers, and Markets • Information and Analysis • Staff Focus • Process Management • Results
Framework Organizational Purpose: Environment, Relationships and Challenges 5: Staff Focus 2: Strategic Planning 1: Leadership 7: Organizational Performance Results 6: Process Management 3: Focus on Patients, Other Customers and Markets 4: Measurement, Analysis and Knowledge Management
MBNQA Category 4INFORMATION AND ANALYSIS Performance Measurement/Analysis • Select and align measures • Gather/integrate data to support daily operations/decision making • Ensure effective use of comparative data • Analyses to support leaders’ review and strategic planning • Communicate results to enable effective decision-making • Align results of analysis
MBNQA Category 4INFORMATION AND ANALYSIS Information Management • Make needed information available to all stakeholders • Ensure data integrity, reliability, accuracy, timeliness, security, confidentiality • Ensure hardware/software reliability and user-friendliness • Keep system current with health care needs
2002 recipient of the Missouri Quality Award Applications development Client Response Center Decision support Compliance Administration Group Information technology SSM Information Center (SSMIC)
Vendors / Consultants Network / Entity IMC Nursing Informatics L I S T E N I N G P O S T N E E D S A S S E S S M E N T S SSMHC System Strategy Medical Informatics System IMC Capital Allocation Committee e-Health / Web IMC I N P U T S HIPAA Entity Service Level Agreements SSM Information Center Revenue Cycle Tactical Teams Operational Teams Project Office ePMI Network/User Group Teams Plan / Check Entity Membership Do / Act IS Planning and Management
Hospital 1 E-mail access SSM Physician Portal Hospital 2 SSM Connect Lotus Notes access Hospital 3, etc Fax machine Pager * Hand-held PDA Physician Connectivity Access Anytime, Anywhere…
Our Mission Exceptional patient, employee, and physician satisfaction Exceptional clinical outcomes Exceptional financial performance
Alignmentof Indicators Through our exceptional health care services, we reveal the healing presence of God. Exceptional clinical outcomes Exceptional patient, employee & physician satisfaction Exceptional financial performance Operating margin % Unplanned re- admission rate within 31 days of discharge Inpatient loyalty Overall physician satisfaction Overall employee satisfaction Service & quality indicators Inpatient loyalty indicators Employee satisfaction indicators Physician satisfaction indicators Reimburse-ment indicators Productivity/ expense indicators Liquidity indicators Profitability indicators Growth indicators Performance Management Process
Performance Indicator Reports (PIR) Data Warehouse Different Source Systems - General Financial (ERP) - Materials Management (ERP) - Human Resources - Clinical Systems - Satisfaction Systems Gathering, Integrating and Presenting Data
Performance Indicator Report (PIR) Rollup System- Level Indicators (SSMHC PIR) Operations PIR Hospital Operations PIR
Operations Performance Indicator Report – System
Consolidated Operations Profitability Operating Margin % 1.5% 2.4% Liquidity Unrestricted Days Cash on Hand 182 209 Hospital Operations Growth Acute Admissions Reimbursement Patient Revenue Per APD Producitvity/Cost Operating Expense Per APD Profitability Operating Margin % Clinical 31 Day Acute Readmission Rate Service & Quality Inpatient Loyalty Index Satisfaction Employee Satisfaction Indicator Satisfaction Physician Satisfaction Indicator 137,656 $1,410 $1,402 3.7% 4.5% 49.5% 74.1% 77.6% 136,884 $1,336 $1,321 4.4% 4.2% 52.9% 71.8% 73.6% Skilled Nursing Home Profitability Operating Margin % Service & Quality Daily Physical Restraints Prevalence Home Health Profitability Operating Margin % Service & Quality Homecare Patient Loyalty Index Physician Profitability Net Revenue Per Physician Productivity Practice Direct Operating Cost % 1.4% 3.9% . 12.0% 56.9% . $35,074 66.6% -1.9% 5.1% . 8.4% 64.0% .. $33,739 68.4% > 5% favorable Within 5% of plan > 5% unfavorable Performance Analysis – System-Level Indicators Year to Date Performance InitiativeIndicatorsActual PlanTo Plan Year to Date Performance InitiativeIndicatorsActual PlanTo Plan
Corrective Action Plans • Hospitals and networks use them frequently … for virtually every red light that exists on the PIR. • Required by policy for certain indicators:
Inprocess Measures • Category 4: Gather/integrate data to support daily operations/ decision-making • Category 6: Inprocess measures used to manage day to day processes? In-process indicators: Measurements that indicate how a process is working. Also called leading indicators. Provide early warning signals to tell us if we are moving towards/away from our goals.
Functional Groups’ Inprocess Measures • ER – Time from door to treatment or physician time (whichever is earlier) • Surgery - % limbs marked: • Correctly • Incorrectly • Not marked • Radiology turnaround time • Pharmacy- Drug cost/patient day (measured daily)
Deploying the Plan • Departmental Posters • Passport Program
Patient-level information Improved clinical outcomes National health care database Opportunities Cost reduction Departmental-level information Comparative Data
Clinical Indicators with Statistically Significant Variation
Lessons Learned • Measurement is essential to improvement • Don’t compare yourself to just averages - - unless you want to be average • Attention to inprocess (leading) indicators as well as to outcome (lagging) indicators • Alignment of measures and strategic goals is essential • Measure what is important