Download
1 / 17
170 likes | 337 Views
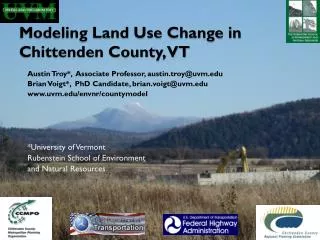
Modeling the Future of Land Use in Chittenden County, VT Part 2: Scenarios. Austin Troy, PhD, austin.troy@uvm.edu And Brian Voigt, brian.voigt@uvm.edu University of Vermont Rubenstein School of Environment and Natural Resources. Alternative Scenarios. Baseline vs. alternative

E N D
Modeling the Future of Land Use in Chittenden County, VTPart 2: Scenarios Austin Troy, PhD, austin.troy@uvm.edu And Brian Voigt, brian.voigt@uvm.edu University of Vermont Rubenstein School of Environment and Natural Resources
Alternative Scenarios • Baseline vs. alternative • Tool for evaluating potential effects of policies and for preparing for possible future contingencies • Does not predict likelihood of policy adoption • How does it work? Simulate conditions of that scenario by changing one or more of the model’s inputs, adding or subtracting a model variable, or encoding behaviors
Categories • Zoning • Ground Transportation Investments • State and Regional Policy • Economic and Demographic Changes • Non-transportation Capital Investments One breakout group for each category
Zoning Hypothetical changes to zoning district boundaries and rules that planners and other stakeholders might be interested in modeling. Examples: upzoning, downzoning or use changes for specific areas where there is an interest in promoting growth, preservation, etc.
Ground transportation investments Hypothetical transportation infrastructure investments that planners and other stakeholders are interested in modeling the effects of. Examples: new roads/highways, exits, interchanges, lane additions, new rail systems, more mass transit, carpooling, etc.
State and Regional Policy Hypothetical state and county level policies, or changes to existing policies, that are expected to affect land use or transportation Examples: • Tax policies • property tax, current use, gas tax, speculation tax, etc. • State land use policies • growth centers, Act 250, urban service boundary, changes to current use development penalties, etc. • Transportation policies • tolls, congestion pricing, etc. • Environmental conservation policies • wetlands and shoreline protection, etc • Out of attainment with air quality standards
Economic and Demographic Change Economic and demographic changes to the county, some of which are planned other of which are not Economic Examples: • loss or gain of a major employer, significant increases or decreases in business taxes, increased telecommuting, spike in the price of energy, energy shortages, new federal requirements for fuel economy or tailpipe emissions, changes in prices of raw materials, changes to the economy due to global warming Demographic Examples: • regional baby boom, a regional influx of residents from other states due to global warming, changes in household characteristics
Non-Transportation Capital Investments • All capital investments not covered by the ground transportation group • Examples: • Utilities: water, sewer, power, telecomm • Schools • Public facilities (libraries, post offices, courthouses) • Airports/Ports/Ferries • Parks/Open Space • Joint public/private developments • Major public institutions
Implementation methods depend on what is being modeled: • Changes to control totals • Changes to base year dbase tables • Change to spatial inputs (GIS editing) • Adding/changing variables to UrbanSim • Adding/changing variables to TransCAD • Combination of above • Programming new behaviors/ processes
? ? ? ? Difficulty level • Changes to control totals • Changes to base year dbase tables • Change to spatial inputs (GIS editing) • Adding/changing variables to UrbanSim • Adding/changing variables to TransCAD • Combination of above • Programming new behaviors ? = increased level of uncertainty due to lack of prior trends or data to analyze or lack of knowledge of behavioral responses
Zoning difficulty examples • Zoning density or use changes • Zoning district merges • Minor zoning boundary edits • Major zoning boundary changes
Ground transportation investments difficulty examples • Proposed features with GIS available • Digitizing • Single road/highway feature • New intersections • New interchanges/exits • New rail routes • Coding • New speed limits • Extra lanes/ new widths ?
State and Regional Policy difficulty examples • Wetlands / riparian protection, etc. • Urban service boundary • Gas tax change • Property tax policy change • Growth Centers (if boundaries available) • Act 250 change • Tolls, congestion pricing, etc. • Out of attainment with air quality standards ? ? ? ? ? ?
Economic and demographic change difficulty examples • Regional baby boom • Influx of residents from other states • Changes in household sizes • Loss or gain of a major employer • Change in business taxes • Increased telecommuting • Spike in the price of energy/ shortage • Fuel economy/ emissions standards • Raw materials price spike ? ? ? ? ? ?
Non-transportation capital investments difficulty examples • Water/ sewer • Power/telecomm • Parks/Open Space • Major public institutions • Public facilities • Airports/Ports/Ferries • Schools • Joint public/private developments ? ? ? ? ? ?
Next steps • Your feedback on scenarios (15 min) • Questions • Suggestions for content and process • Break (10 min) • Breakout Groups (~50 min) • Dot voting on results • Wrap-up
Breakout Groups • Goals: • Produce no more than four ranked scenarios • Give each a name and as much specification as possible • Process • 2 Facilitators per table • Generate and “aggregate” ideas • Rank, reduce and describe • Present to group, using poster paper • Use drawings on maps if necessary