Download
1 / 15
160 likes | 351 Views
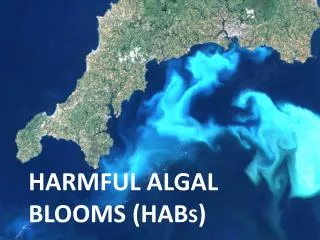
Nutrients and Karenia Blooms - The Application of ArcGIS in HAB research Bingzhang Chen Marine Science Institute November, 18 th , 2004. Karenia. K. Mikimotoi Very similar appearance and size to K. Brevis produces hemolytic compounds Respiratory irritation for humans. K. Brevis

E N D
Nutrients and Karenia Blooms- The Application of ArcGIS in HAB researchBingzhang ChenMarine Science InstituteNovember, 18th, 2004
Karenia K. Mikimotoi Very similar appearance and size to K. Brevis produces hemolytic compounds Respiratory irritation for humans K. Brevis Unarmored dinoflagellate, about 18–45 µm in size Icthyotoxic, Can kill mammals
Goal: find out the relationship between nutrients and Karenia blooms Karenia ~ [TIN] Karenia ~ [PO4]
Data Source • Red Tide Monitoring Project conducted at Marine Science Institute (MSI), UT. • Time Range: 1 Nov., 1998 – 10 April, 2001 • Data Types: Karenia cell counts, Chlorophyll a, TIN, Phosphate
Study Area Five regular sampling sites for the Coastal Fisheries Divisions (TPWD) finfish surveys along the Texas coast.
Using ArcGIS • Display basemap and monitoring points in ArcMap. • 2. Construct a large TimeSeries table.
Using ArcGIS 3. Use Tracking Analyst to track the changes of Karenia cell densities and nutrient concentrations.
Use Tracking Analyst to track a minor red tide event in Oct/Nov, 1999 Before the occurring of this red tide (9/20/1999):
Use Tracking Analyst to track a minor red tide event in Oct/Nov, 1999 10/5/1999, TIN increased.
Use Tracking Analyst to track a minor red tide event in Oct/Nov, 1999 10/20/1999, the Karenia bloom occurred and TIN decreased.
Use Tracking Analyst to track a minor red tide event in Oct/Nov, 1999 11/5/1999, the Karenia bloom persisted and nutrients were still low.
Use Tracking Analyst to track a minor red tide event in Oct/Nov, 1999 12/5/1999, the Karenia bloom disappeared and TIN levels appeared to increase again.
Some Results • Tracking Analyst is a good way to represent the variations of Karenia cell numbers and nutrient levels. • Karenia can survive and bloom in low phosphate environment. • 70% of Karenia blooms occurred during autumn and winter. • No significant correlations exist between TIN and phosphate.
Any good ideas to work on these data? Statistics ?